


Highlights
- High-grade copper-gold intersections reported at Green Bay support resource upgrades.
- Other income of FFM surged 1173% YoY in 1HFY25, while net loss narrowed to AUD 5.73 million.
- FFM shares closed at AUD 1.05 on 25 March 2025, gaining 16.02% in three months.
FireFly Metals Limited (ASX:FFM) is an emerging copper-gold company and is making significant progress in developing its Green Bay Copper-Gold Project in Newfoundland, Canada. The company has a clear strategy to convert Inferred Resources into Measured and Indicated categories, thereby increasing the economic potential of its projects. Ongoing regional drilling and exploration initiatives aim to uncover high-grade mineralised zones, which is expected to boost the project’s long-term value and position FFM for future growth.
Encouraging Drilling Results at Green Bay
On 25 March 2025, FireFly Metals provided an update on its drilling activities at the Green Bay project. The results from drilling the Massive Sulphide (VMS) lenses have been promising, with high-grade intersections confirming the presence of copper and gold-rich zones. These findings set the stage for upgrading existing resources. Additionally, the company has outlined plans for further infill drilling to assess a newly discovered thick, high-grade mineralised zone at the northern margins of the current resource.
Financial Performance in 1HFY25
For the half-year ended 31 December 2024 (1HFY25), FireFly Metals reported other income of AUD 2.87 million (up 1173% YoY), driven by maritime investment gains, flow-through share premiums, and asset sales from the Green Bay project.
The company’s loss after income tax narrowed to AUD 5.73 million, a notable improvement from AUD 15.52 million in the previous period. Additionally, FireFly Metals bolstered its cash position, reporting AUD 76.02 million in cash and cash equivalents, largely supported by AUD 69.3 million in net proceeds from a share placement and purchase plan.
Outlook
The company plans to focus on upgrading resources through additional drilling, while regional exploration initiatives will leverage surface drilling and geophysical surveys to identify new high-priority prospects.
The Green Bay project’s upcoming mining studies are expected to confirm its viability as a large-scale, long-life copper-gold asset.
Share performance of FFM
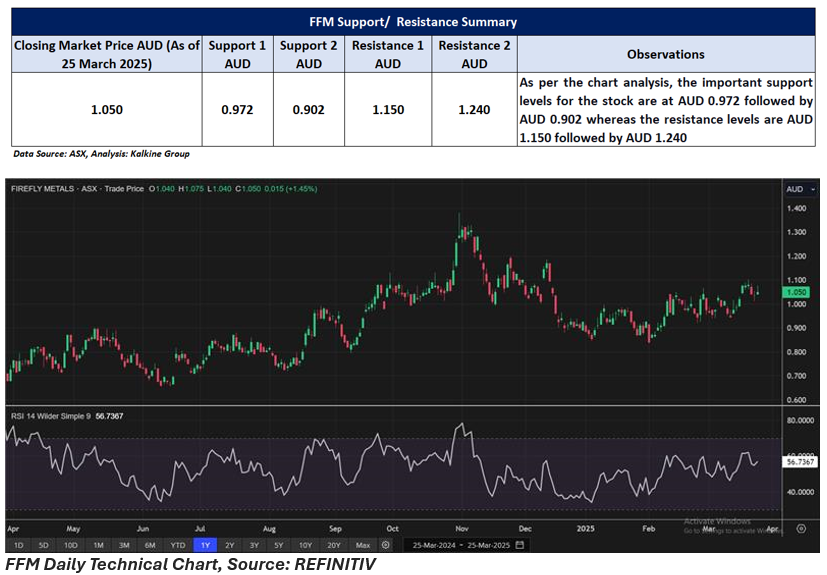
FFM shares closed 1.45% higher at AUD 1.05 per share on 25 March 2025. Over the past year, FFM’s share price has dropped by almost 54.41%, while in the last three months, it has gained almost 16.02%.
52-week high of FFM is AUD 1.38, recorded on 31 October 2024 and 52-week low is AUD 0.655, recorded on 17 June 2024.
Support and Resistance Summary
Note 1: Past performance is neither an Indicator nor a guarantee of future performance.
Note 2: The reference date for all price data, and currency, is 25 March 2025. The reference data in this report has been partly sourced from EODHD/Others.
Technical Indicators Defined:
Support: A level at which the stock prices tend to find support if they are falling, and a downtrend may take a pause backed by demand or buying interest. Support 1 refers to the nearby support level for the stock and if the price breaches the level, then Support 2 may act as the crucial support level for the stock.
Resistance: A level at which the stock prices tend to find resistance when they are rising, and an uptrend may take a pause due to profit booking or selling interest. Resistance 1 refers to the nearby resistance level for the stock and if the price surpasses the level, then Resistance 2 may act as the crucial resistance level for the stock.
Disclaimer
This article has been prepared by Kalkine Media, echoed on the website kalkinemedia.com/au and associated pages, based on the information obtained and collated from the subscription reports prepared by Kalkine Pty. Ltd. [ABN 34 154 808 312; AFSL no. 425376] on Kalkine.com.au (and associated pages). The principal purpose of the content is to provide factual information only for educational purposes. None of the content in this article, including any news, quotes, information, data, text, reports, ratings, opinions, images, photos, graphics, graphs, charts, animations, and video is or is intended to be, advisory in nature. The content does not contain or imply any recommendation or opinion intended to influence your financial decisions, including but not limited to, in respect of any particular security, transaction, or investment strategy, and must not be relied upon by you as such. The content is provided without any express or implied warranties of any kind. Kalkine Media, and its related bodies corporate, agents, and employees (Kalkine Group) cannot and do not warrant the accuracy, completeness, timeliness, merchantability, or fitness for a particular purpose of the content or the website, and to the extent permitted by law, Kalkine Group hereby disclaims any and all such express or implied warranties. Kalkine Group shall NOT be held liable for any investment or trading losses you may incur by using the information shared on our website.
