


Highlights
- Evolution Energy Minerals Limited (ASX:EV1) shares rose nearly 4% on Thursday
- The stock is up nearly 20% on a YTD basis
- The company develops and explores Chilalo Graphite Project in southern Tanzania
Shares of Evolution Energy Minerals Limited (ASX:EV1), the company which develops and explores Chilalo Graphite Project in southern Tanzania, ended nearly 4% higher at AUD 0.270 on Thursday, 27 April 2023, outperforming the ASX benchmark S&P/ASX 200 index, which settled 0.32% lower at 7,292.70.
With Thursday's higher closing, the stock has appreciated 20% year-to-date (YTD). But most of the gains in the stock has come on and after 11 April 2023, when the company announced that it would sign a formal agreement with the Government of Tanzania for the ownership, development and management of the Company’s Chilalo Graphite Project, the details of which were agreed with the Government of Tanzania in March 2023. On that day, EV1 shares gained 8.33% to close at AUD 0.260 per share.
On 18 April 2023, when the company announced that the above agreements had been signed, the stock witnessed another major up move of nearly 6%. The agreements confirm the Tanzanian Government’s commitment to jointly develop the project. Evolution's managing director Phil Hoskins had said, the agreement is a key milestone for the company in the development of the Chilalo Project.
Given this backdrop, let’s study the technical chart of EV1 to know where the stock is heading in the near term.
EV1’s Technical Analysis:
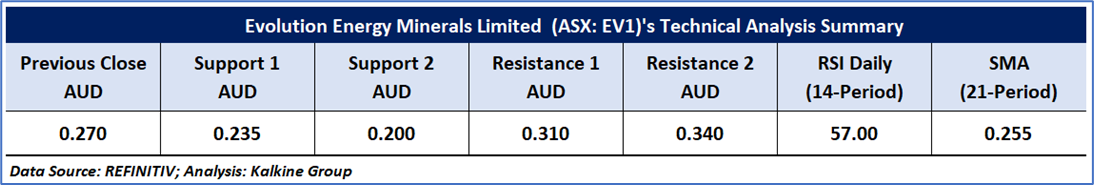
On the daily chart, EV1's stock price is on the rise after forming multiple positive divergences compared to the relative strength indicator. Moreover, the stock is also developing a symmetrical triangle pattern, supporting the positive bias. In addition, the RSI (14-period) is moving north, and both the 21-period and 50-day SMAs are trading below price, which may act as support levels for the stock. Important support for the stock is positioned at AUD 0.235, while key resistance is placed at AUD 0.310.
Daily Technical Chart – EV1

The technical levels for the stock were evaluated as per the closing price of AUD 0.270 per share, as on 27 April 2023, up by 3.85%.
Note 1: Past performance is neither an Indicator nor a guarantee of future performance
Technical Indicators Defined:
Support: A level at which the stock prices tend to find support if they are falling, and a downtrend may take a pause backed by demand or buying interest. Support 1 refers to the nearby support level for the stock, and if the price breaches the level, then Support 2 may act as the crucial support level for the stock.
Resistance: A level at which the stock prices tend to find resistance when they are rising, and an uptrend may take a pause due to profit booking or selling interest. Resistance 1 refers to the nearby resistance level for the stock and if the price surpasses the level, then Resistance 2 may act as the crucial resistance level for the stock.
Stop-loss: It is a level to protect further losses in case of unfavourable movement in the stock prices.
The Green colour line reflects the 21-period moving average. SMA helps to identify existing price trends. If the prices are trading above the 21-period, prices are currently in a bullish trend (Vice – Versa).
The Blue colour line reflects the 50-period moving average. SMA helps to identify existing price trends. If the prices are trading above the 50-period, prices are currently in a bullish trend (Vice – Versa).
The Orange/ Yellow colour line represents the Trendline.
The Purple colour line in the chart’s lower segment reflects the Relative Strength Index (14-Period), which indicates price momentum and signals momentum in trend. A reading of 70 or above suggests overbought status, while a reading of 30 or below suggests an oversold status.
Disclaimer
This article has been prepared by Kalkine Media, echoed on the website kalkinemedia.com/au and associated pages, based on the information obtained and collated from the subscription reports prepared by Kalkine Pty. Ltd. [ABN 34 154 808 312; AFSL no. 425376] on Kalkine.com.au (and associated pages). The principal purpose of the content is to provide factual information only for educational purposes. None of the content in this article, including any news, quotes, information, data, text, reports, ratings, opinions, images, photos, graphics, graphs, charts, animations, and video is or is intended to be, advisory in nature. The content does not contain or imply any recommendation or opinion intended to influence your financial decisions, including but not limited to, in respect of any particular security, transaction, or investment strategy, and must not be relied upon by you as such. The content is provided without any express or implied warranties of any kind. Kalkine Media, and its related bodies corporate, agents, and employees (Kalkine Group) cannot and do not warrant the accuracy, completeness, timeliness, merchantability, or fitness for a particular purpose of the content or the website, and to the extent permitted by law, Kalkine Group hereby disclaims any and all such express or implied warranties. Kalkine Group shall NOT be held liable for any investment or trading losses you may incur by using the information shared on our website.
