


Medlab Clinical Limited (ASX: MDC) is an ASX listed healthcare company which is developing therapeutic pathways for diagnosed chronic diseases. The company has also moved forward developing therapies for obesity, depression and pain management. It is also developing cannabis-based medicines to be used in pain management.
On 28th May 2019, the company announced the execution of Heads of Agreement (HoA) with Mega Lifesciences Public Company Limited (Mega) with the main aim of continuing the distribution of NanaBis⢠on a global scale.
Mega is a Thai listed pharmaceutical company, established in 1982. The company provides millions of people with access to quality, effective, safe, and ethical nutritional & herbal supplements and OTC products. It is headquartered in Bangkok with operations across 33 countries.
NanaBis⢠is a highly purified proprietary blend of CBD/THC using its patented sub-micron delivery platform (NanoCelleâ¢). It is a buccal spray which is currently in the 2nd stage of an Australian cancer pain trial. Further, it is available for use under the Australian governmentâs Special Access Scheme.
Dr Sean Hall, CEO and MD of the company, stated that the company is looking to fast-track the global drug approval for NanaBisâ¢, he believes that it is at a compelling stage of its development. Furthermore, the collaboration with Mega provides Medlab Clinical with the opportunity to expand NanaBisâ¢, quickly across the world.
On 5th March 2019, the company had signed HoA with Pharmascience Inc NanaBisâ¢.
On 9th January 2019, the company reported an update on NanoStatTM
Letâs have a look at the technical structure of the stock.
Technical Outlook
On the daily chart, the stock had been consolidating in a range for quite a few months, since December 2018 till May 2019. However, the range was not defined by the traditional support or resistance levels because the buying and selling throughout consolidation, was seen at different levels.
Here comes a more mathematically advanced tool to gauge the range of the market and that is Bollinger band. Bollinger band measures/indicates volatility to contain the prices within a band which converge or diverge based on the contraction or expansion in the volatility.
Most of the times the prices will be contained within the band as these bands are self-adjusting to the prices. That simply means if the price tries to break the band in either of the direction, very soon the bands will expand more to contain the price that is going out of the band.
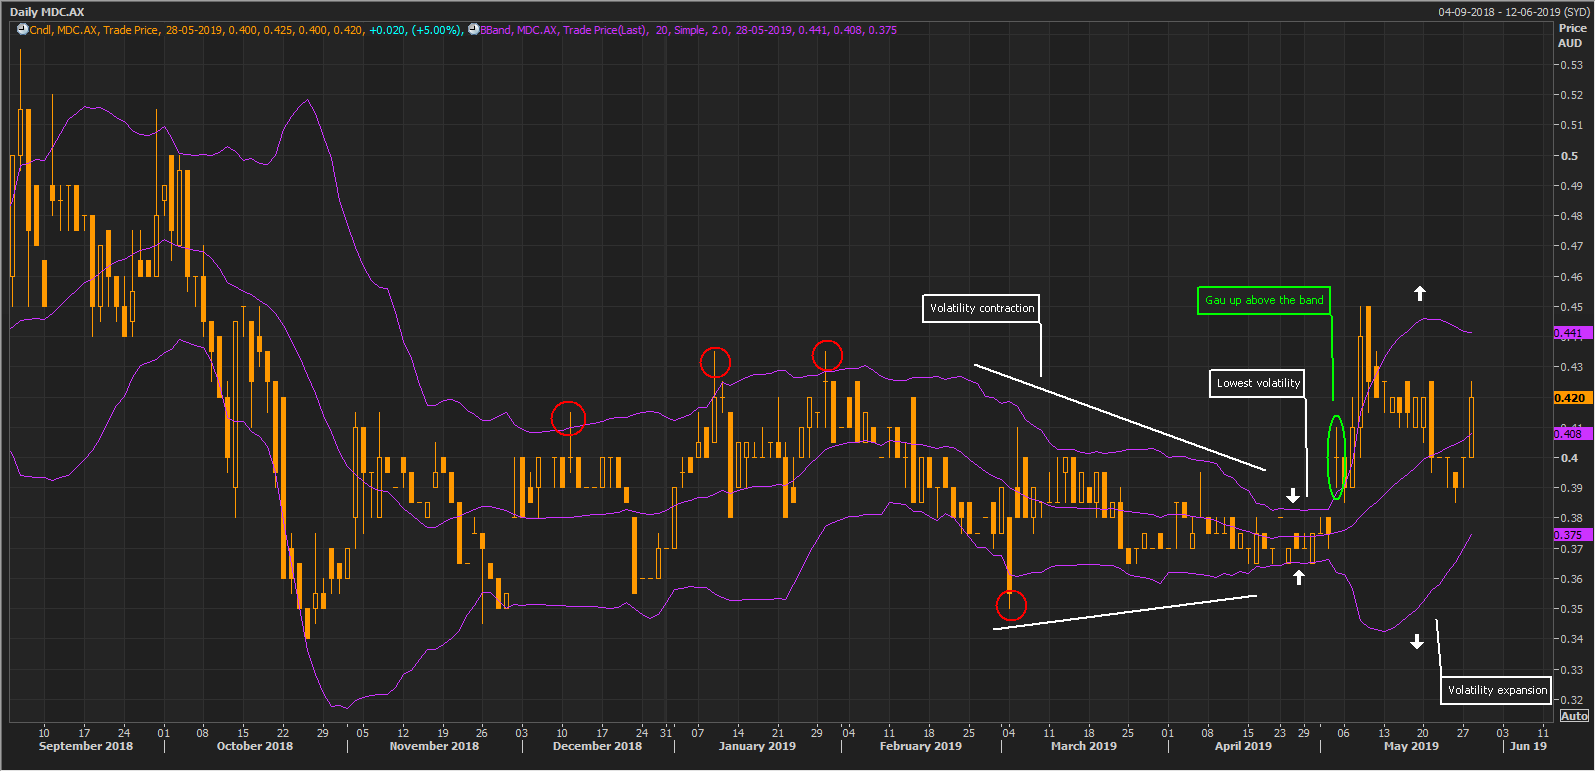 Daily chart of Medlab Clinical Limited (Source: Thomson Reuters)
As seen in the chart from December 2018, the bands are moving in a sideways range, and all the prices were contained within, despite the failed attempt to break the band on several occasions (marked in red circles on the chart). As noticed till the time the stock reached May 2019, the bands were squeezed a lot, which stated a contraction in volatility, and was the lowest for the year. This contraction is being interpreted as a soon to come move in the stock price, the direction of which is unknown.
Soon around the starting of May 2019, first time the price successfully breached the band with a gap up opening and subsequently gave a short-term swing rally. This resulted in the expansion in the volatility and resulted in the expansion of BB bands. Now, as the price volatility is back, we can expect some moves in the stock price.
Stock Performance
The company has a market capitalisation of A$84.41 million, and the stock had touched a 52-week high and low of A$0.57 and A$0.34 respectively. The stock closed the dayâs trade flat at A$0.400 (as on 28th May 2019). The last one-year return of the stock is negative 25.9%, and the YTD return stands at 2.56%.
Disclaimer
This website is a service of Kalkine Media Pty. Ltd. A.C.N. 629 651 672. The website has been prepared for informational purposes only and is not intended to be used as a complete source of information on any particular company. Kalkine Media does not in any way endorse or recommend individuals, products or services that may be discussed on this site. Our publications are NOT a solicitation or recommendation to buy, sell or hold. We are neither licensed nor qualified to provide investment advice.
