


Summary
- After a brief period of moving in a downtrend, the home currency has reversed direction with the price now moving and confirming a trend reversal.
- The developing price pattern on charts and technical indicators are reflecting that there might be some steam left in the Aussie dollar against the United States dollar.
- However, some crucial resistances are still intact, and some technical indicators are showing an overbought condition.
The home currency is currently on strong footing in the wake of monetary stimulus injected by the Reserve Bank of Australia (or RBA), economic stimulus injected by the Morrison Government, and over all positive position of Australia on the COVID-19 front as compared to other developed nations across the world. The price of the home currency is gaining strength against the United States dollar with prices surging from the level of USD 0.5507 (intraday low on 19 March 2020) to the present high of USD 0.7149 (as on 22 July 2020 4:22 PM AEST), which marks an appreciation of ~ 29.81 per cent since the onset of the second quarter.
To Know More, Do Read: Home Currency to Stand Tall Against the U.S. Dollar?
RBA Keeps Rates at All-Time Low
In the latest monetary policy meeting on 7 July 2020, RBA decided to keep the interest rate unchanged at an all-time low of 25bps, reaffirming that the agency would keep the three-year target of government bond yields unchanged at 0.25 per cent.
- In the recent past, the monetary measures along with the stimulus provided by the government have provided a cushion to the domestic economy, leading to a surge in the home currency value against the U.S. dollar.
The Rallying Aussie Dollar
The Australian dollar has gained nearly 29.81 per cent value against the United States dollar since the beginning of the second quarter, and the chart patterns and technical indicators are keenly tracked to gauge if there might be some steam left in the rally.
- AUD on Charts
Daily Chart
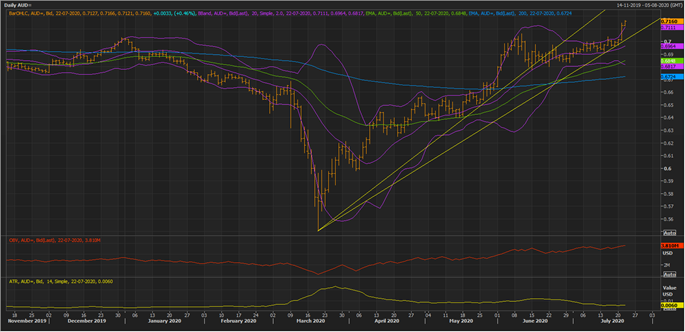
AUD Daily Chart (Source: EODHD/Others Eikon Thomson Reuters)
On the daily chart, it could be seen that the AUD is showing strong momentum with prices surging above the 200-day exponential moving average. The pair of 50-day EMA and 200-day EMA is now showing a positive crossover, which is further suggesting that the currency has changed trend against the U.S. dollar.
- Furthermore, AUD has given a volatility breakout with prices crossing the +2 Standard Deviation (or SD) of the 20-day simple Bollinger band. If the price sustains the volatility breakout and confirms the same, it could seed bullish sentiments ahead.
However, it should be noticed that different traders apply different confirmation rule and once should select their own confirmation rule based upon the acceptable risk and reward profile.
To Know More, Do Read: Swing Trading- Repeating Smaller Profits Over Time, How to Apply, What to look?
Also, it should be noticed that the On Balance Volume is moving in tandem with the price action, which coupled with declining volatility, inferred from declining Average True Range and squeezing Bollinger band, suggests that currently the accumulation phase of the changing trend is losing momentum.
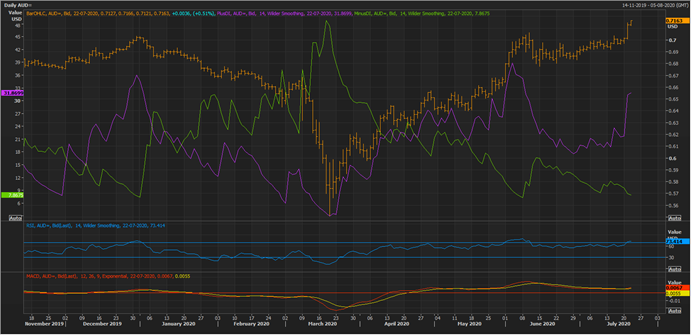
AUD Daily Chart (Source: EODHD/Others Eikon Thomson Reuters)
On applying the plus and minus Directional Index on the daily chart, it could be seen that the plus DI crossed the minus DI from below, which along with the enlarging distance between them is suggesting that bulls are currently dominating the market sentiment.
- Furthermore, it should be noticed that the 12,26,9 MACD indicator is also showing a positive cross, which, along with the large spread between DIs could further attract bullish sentiments.
The 14-day Relative Strength Index is currently moving in tandem with the price direction and other indicators and is currently above the mean value; however, it should be noted that the RSI is fast approaching the overbought zone and also is showing a slight divergence.
- While the Aussie dollar has reached the current high of USD 0.7149, the 14-day RSI is still below its peak value seen during the previous peak in prices, which in turn, raises a flag that a short-term correction could be witnessed.
If the prices take any correction in the future, the mean value of the Bollinger band should act as the primary support for the price followed by the trendline.
- The -2 SD of the Bollinger should act as decisive support as it is overlapping with the 50-day EMA, and any break below, if sustain, could seed bearish sentiments.
Weekly Chart
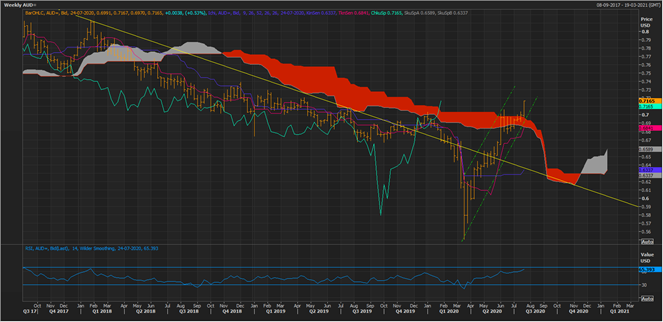
AUD Weekly Chart (Source: EODHD/Others Eikon Thomson Reuters)
On the weekly chart, the currency is rising in an upward sloping price channel with some bullish indications from the price behaviour and technical indicators.
- In the upward sloping channel, the currency is making higher successive highs and higher successive lows, reflecting that bulls are quite active on every dip.
- Furthermore, Span A of the Ichimoku cloud or the mean value of the conversion line and the base line is trading above the Span B, which is the mean value of 52-week high and low, suggesting that the short- to medium-trend is bullish in nature.
- Also, the conversion line (pink) or the mean value of 9-week high and low is giving a positive crossover with the conversion line or the mean value of 26-week high and low (navy blue).
- However, it should be noticed that the crossover between the conversion line and the base line took place below Span B, which in turn, is not so much or strongly bullish in nature.
- The currency is currently trading around the red cloud zone, which is the resistance level and has given a break above the same.
If the currency sustains above the red cloud zone and confirms the breakout, it might further seed bullish sentiments.
- The 14-week RSI is moving in tandem with the price action and is above its mean value while hovering below the overbought zone.
In a nutshell, the home currency which has witnessed a strong rally in the recent past is showing a change in trend, and the emerging price behaviour and technical indicators are suggesting that there might be some steam left in the price against U.S. dollar.
However, some resistances are yet intact, which need to be breached with decent confirmation signal to seed further bullish sentiments.
