


Cash is King, as the business needs cash to run the processes smoothly - to manufacture, distribute and market the products and other ancillary functions. It is here, when the importance of free cash flow emerges which can be understood, prima facie, as Net Operating Profit after Tax (NOPAT) less increase or decrease in invested capital in the same year.
Free cash flow indicates the financial health of the business and the ability to invest in new opportunities. It also suggests market participants to understand the availability of the fund for distribution in terms of dividends. However, there are circumstances which tend to generate positive free cash flow but not sustainable for longer-term. These circumstances include divesting major business assets, delay in capital expenditures, late payments of accounts payable, early receivable receipts with high-cost early payment discounts, payment of earlier dividends, a cut in key maintenance expense, reduced marketing expenses, curbing scheduled pay increases, significant advance from a customer, agreement of sale and leaseback for key assets. The generated funds from these activities will be short lived.
Growth rate of a business also impact the free cash flow situation for a company. Higher funds and investments towards accounts receivable and inventory are required for a company, growing with higher rate resulting in an increase in working capital investment and decrease in free cash flow. Vice-versa, a business with decelerating growth or shrinking business would witness a conversion of its working capital back into cash as paid receivables and liquidated inventory, hence, an increasing amount of free cash flow will be misleading.
Further, repatriation of cash from a subsidiary is also a matter which investors should understand while analysing the free cash flow. In case, any of the companyâs subsidiaries enjoy better free cash flow, it will not make a big difference to the parent company, if it cannot access the cash on the back of tight norms for cash repatriation.
How to calculate FCF? - Free Cash Flow (FCF) can be achieved through deducting capital expenditure from operating cash flow. FCF is nothing but cash to be availed for distribution to debt holders and equity holders. The distributable amount deducts the bills to be paid, and after provisions which have been made for the future for certain expenditure or others. This metric has significant importance as it represents the fund available to enhance shareholders value.
Formula:
Free cash Flow (FCF) = Operating cash flow â Capital Expenditure
Operating cash flow is easily available on the cash flow statements given by the company. It reports the amount of cash inflows or outflows from the operations of a company. Capital expenditure includes the overall activities, which are used for the longer-term perspective such as investment in property or selling off a business unit.
With the help of FCF we can calculate various ratio metrics which are helpful while analysing a stock.
- Free Cash Flow Yield (FCFY) is a key financial ratio which can be attained with the help of below given formula.
Free Cash Flow Yield = Free Cash Flow / Market Capitalisation
The ratio can be calculated as a percentage of fund on market capitalisation (= shares outstanding x share price) and expresses the % of fund left compared to the price of the stock. It reveals the value an investor is receiving for the investment dollar.
A business might have a higher cash flow on the books in comparison to its assets, but in a case where the stock price is so expensive, that the value for the investor is low. Also, there might be a case where cash flow in comparison to the assets of business is low, but the stock price could be a bargain that the value for the investor is high.
- Net Free Cash Flow Yield considers the further allowances for the current portion (more than one year) of long-term debt on the balance sheet along with the dividends which a company would pay.
Net Free Cash Flow (NFCF) = Free Cash Flow (FCF) â current portion of long-term debt â current portion of future dividends (1-year)
We would now be discussing 3 stocks to understand the free cash flow situation and factors impacting it:
MyState Limited
MyState Limited (ASX: MYS) is primarily engaged with the banking services, trustee services and wealth management. Under the banking services, the company offers personal, residential and business lending, transactional, internet and mobile banking, savings and investments, and Insurance & other alliances. Within Trustee services, the company offers services such as estate planning, estate and trust administration, power of attorney, and corporate trustee. Wealth management segment provides managed fund investments, financial planning, portfolio administration services, portfolio advisory services and private client services.
Inking of Sale & Purchase agreement with FID: The company, recently on 17 July 2019, inked a sale and purchase agreement with Fiducian Group Limited (ASX: FID) for the acquisition of MyStateâs retail financial planning business. As per the deal, FID will pay circa $3.5 million to acquire a client book for financial planning clients with more than $340 million in funds under advice.
The company has seen a consistent growth in free cash flow over last 5 years from $32.19 million in FY14 to $43.42 million in FY18. Cash flow from operating activities stood at $39.06 million in FY14 to $49.68 million in FY18. Capital expenditure during FY18 stood at $6.27 million and $6.88 million in FY14. Consequently, free cash flow during FY18 and FY14 came in at $43.42 million and $32.19 million.
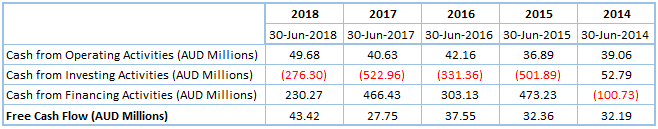
MYSâ Free Cash Flow for Last 5 Years (Source: Thomson Reuters)
On 30 July 2019, the current market price of A$4.67 (at AEST 3:09 PM) of MYSâ stock is available at the price to earnings multiple of 13.940x with an annual dividend yield of 6.2%. The stock is up by 0.647% and currently trading towards the higher end of 52-week range of A$4.020 - A$4.970.
Noni B Limited
Noni B Limited (ASX: NBL) is engaged with the retailing of clothing and accessories of the females.
Trading Update FY19: The company recently came up with the trading update for FY19 wherein it mentioned that the FY19 total sales for the group stood at $864 million with store network of 1,379 after a net movement of -47 stores. Online sales as a proportion of total sales stood at 9.8% of total sales for FY19 whereas like-for-like sales ended with the negative growth of 4.3% which was in-line with the management expectations. With this, the Management expects FY19 EBITDA to be in line with guidance of ~$45 million, reflecting a growth of 21% on FY18.
Cash flow from the operating activities remained positive in last 5-years barring FY 2014 where NBL faced the operating cash outflow of $2.10 million. Capital expenditure for the period of FY14, FY15, FY16, FY17 and FY18 stood at $1.99 million, $1.85 million, $4.13 million, $11.32 million, and $14.92 million, respectively.
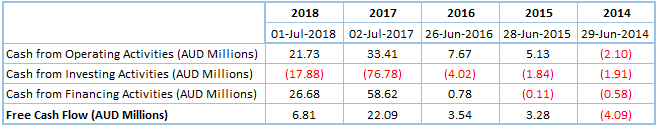 NBLâs Free Cash Flow for Last 5 Years (Source: Thomson Reuters)
At the current market price of A$2.630, the NBLâs stock is trading flat (at AEST 3:20 PM). Its 52- week low is A$2.310 and 52-week high is A$3.900. The stock is trading at the price to earnings multiple of 15.940x with an annual dividend yield of 4.94%. In the last 1-year period, the stock has given a negative return of 20.54 percent.
Tribune Resources Limited
Tribune Resources Limited (ASX: TBR) is engaged with the exploration, development and production activities at the Groupâs East Kundana Joint Venture tenements (EKJV). The company, recently on 24 July 2019, notified to the market about the approval of Mining Lease Application for the Japa Project in Ghana.
June 2019 Quarterly Report: On 30 July 2019, the company released June 2019 Quarter Results, wherein it mentioned that during the period processing of 230,188 tonnes of EKJV ore at Kanowna Plant took place. Further, the processing of 105,183 tonnes of EKJV ore and 0 tonnes of R&T ore took place at Greenfields Mill.
Besides, 34, 120 ounces of gold and 6,347 ounces of silver have been credited to Rand and Tribune Bullion Accounts.
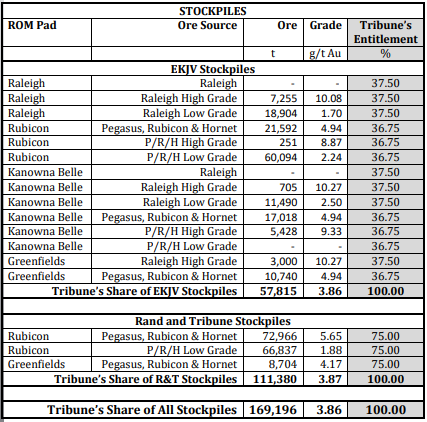
Source: Companyâs Report
From the cash flows perspective, during the quarter, the net cash used in operating activities stood at A$29,060k.The net cash used in investing activities was recorded at A$1,015k and the next cash used in financing activities stood at A$967k. The cash and cash equivalents at the end of the quarter was noted at A$59,239k.
Further, looking at the cash flow activities, the fund from operation increased substantially from $27.92 million FY14 to $53.26 million in FY18. Free cash has been positive during FY14 to FY18, except FY2015 which saw a negative free cash flow of $0.48 million.
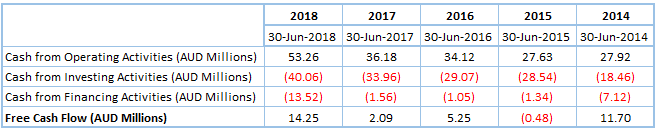 TBRâs Free Cash Flow for Last 5 Years (Source: Thomson Reuters)
At the current market price of A$7.11 (at AEST 3:43 PM) TBRâs stock is available at the price to earnings multiple of 5.220x. The Market capitalization for the stock stands at A$388.52 million. The stock has given a return of ~78.57% in the last one-year period and is currently trading towards the higher end of 52-week range of A$3.750 - A$8.500.
Disclaimer
This website is a service of Kalkine Media Pty. Ltd. A.C.N. 629 651 672. The website has been prepared for informational purposes only and is not intended to be used as a complete source of information on any particular company. Kalkine Media does not in any way endorse or recommend individuals, products or services that may be discussed on this site. Our publications are NOT a solicitation or recommendation to buy, sell or hold. We are neither licensed nor qualified to provide investment advice.
