


Telecommunications Services index at the time of writing was trading at 1272.7 (AEST 3: 36 PM), which is ~7.8% down from its recently made 52 weeks high level of 1380.40 on July 30, 2019.
Let us look at five important communication stocks along with their recent updates, Domain Holdings Australia Limited (ASX:DHG), Event Hospitality and Entertainment Ltd (ASX:EVT), Chorus Limited (ASX:CNU), Hutchison Telecommunications (Australia) Limited (ASX:HTA) and MNC Media Investment Ltd (ASX:MIH).
Domain Holdings Australia Limited (ASX:DHG)
Based in New South Wales, Domain Holdings Australia Limited (ASX:DHG) is involved in real estate tech and services business, with focus on the Aussie property market. The company also provides media and lead-generation solutions for advertisers to promote their products and services to consumers.
Recently, the company announced 2,972,219 unquoted options at an exercise price of $3.0169. The vesting of the security is subject to vesting criteria over a 3-year performance period which would be tested on June 30, 2022, with the expiry of June 30, 2024.
FY19 Key Highlights (ended on June 30, 2019): Underlying revenue for the period was reported at $335.6 Mn, which is a decrease of 6.1% on previous year, whereas the statutory revenue for the period (FY19) was reported at $343.3 Mn. Underlying EBITDA for the period decreased by 15.3% to $98 Mn, and underlying EBIT for the period declined by 26.4% to $65.9 Mn.
The underlying net profit after tax for the period decreased by 29.3% to $37.4 Mn, whereas the company reported statutory net loss after tax of $137.6 Mn (including significant items). At the end of the period, net debt of the company was reported at $113.2 Mn.
The Board of Directors declared a dividend of 4¢ per share (100% franked), taking the full year dividend to 6¢, with a pay-out ratio of 93% for the full year.
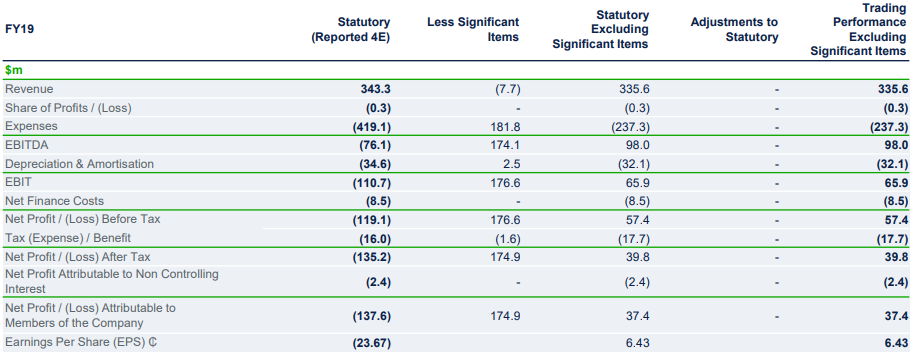
FY19 Income Statement (Source: Company Reports)
On the stock information front
On October 1 at 3:26 PM AEST, the DHG stock quoted $3.540, up 4.42%, with a market cap of ~$1.98 Bn. Its 52 weeks high and 52 weeks low stand at $3.600 and $2.060, respectively, with an annual average volume of 1,227,838. It has generated an absolute return of -3.42% for the last one year, 30.38% for the last six months, and 4.63% for the last three months.
Event Hospitality and Entertainment Ltd (ASX:EVT)
Event Hospitality and Entertainment Ltd (ASX:EVT) is involved in the cinema exhibition operations across Australia (including technology equipment supply and servicing, and the State Theatre), NZ and Germany. It is involved in the ownership, management and operation of hotels and resorts in Australia and beyond, along with development of property, investment properties, and investment in shares in listed and unlisted companies.
Recently, the company notified about the resignation of Ken Chapman as an independent non-executive director.
FY19 Key Highlights (ended on June 30, 2019): Group revenue from continuing operations was reported at $998 Mn, which is an increase of 2% on the prior year. Normalised profit after income tax from continuing operations was reported at $104.3 Mn, which is a decrease of 6.7% on previous year. Statutory net profit after tax (NPAT) including discontinued operations for the period was reported at $111.9 Mn, consistent with the previous year.
The result was driven by decent growth from Thredbo, New Zealand cinemas and Hotels, offset by Australian cinema marketâs relatively weaker second half performance. The Board of Directors declared a dividend (fully franked) of $0.31000, with record date and payment date on September 5, 2019 and September 19, 2019, respectively.
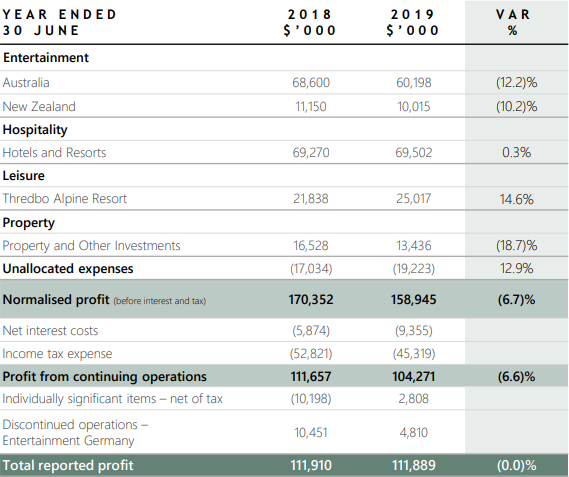
FY19 Key Financial Metrics (Source: Company Reports)
On the stock information front
On October 1 at 3:26 PM AEST, the EVT stock quoted $13.260, down 1.70%, with a market cap of ~$2.17 Bn. Its 52 weeks high and 52 weeks low stand at $14.870 and $11.300, respectively, with an annual average volume of 81,642. It has generated an absolute return of -8.85% for the last one year, -1.68% for the last six months, and 8.35% for the last three months.
Chorus Limited (ASX:CNU)
Telecommunications infrastructure provider Chorus Limited (ASX:CNU) operates throughout New Zealand. Majority of exchange equipment and telephone lines in New Zealand are owned by the CNU.
Recently, Mitsubishi UFJ Financial Group, Inc., Realindex Investments Pty Limited, ceased to be the substantial holder in the company, by reducing stake from 5.446% to 4.993%, effective from September 24, 2019.
In another update, Sue Bailey has been nominated as a Chorus director and would stand for election as an independent non-executive director at CNUâs 2019 annual shareholdersâ meeting.
FY19 Key Highlights (ended on June 30, 2019): EBITDA for the period was reported at NZ$636 Mn as compared to NZ$653 Mn in FY18, in-line with guidance of NZ$625 Mn to NZ$645 Mn. Capital Expenditure for the period with successful peak communal rollout, was reported at NZ$804 Mn, slightly below guidance.
Close to 186,000 fibre installations were reported in the period, and the household data usage on copper and fibre connections throughout CNUâs network was up to 265 GB (55 GB increase on previous year). Operating revenue for the period was reported at NZ$970 Mn, as compared to NZ$990 Mn, and operating expenses for the period was reported at NZ$334 Mn, as compared to NZ$337 Mn in the previous year.
Depreciation and amortisation for the period was reported at NZ$393 Mn, as compared to NZ$387 Mn in the previous year. Net profit after tax for the period was NZ$53 Mn, reflecting slumped revenue and enhanced interest costs of borrowing with the objective of funding the UFB rollout.
The Board declared a dividend of NZ$0.135 ps (final).
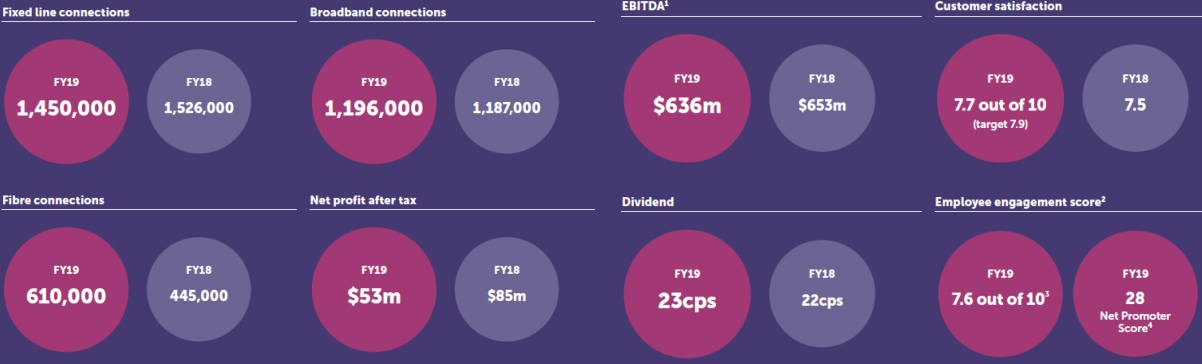
FY19 Key Metrics (Source: Company Reports)
On the stock information front
On October 1 at 3:26 PM AEST, the CNU stock quoted $4.780, up 3.2%, with the market cap of ~$2.03 Bn. Its PE multiple stands at 40.370x and annual dividend yield stands at 4.74%. Its 52 weeks high and 52 weeks low stand at $6.070 and $4.210, respectively, with an annual average volume of 593,432. It has generated an absolute return of 4.28% for the last one year, -17.62% for the last six months, and -14.26% for the last three months.
Hutchison Telecommunications (Australia) Limited (ASX:HTA)
Based in New South Wales, Hutchison Telecommunications (Australia) Limited (ASX:HTA) has 50% ownership in VHA, an Australian telecom services provider.
Recently, one of the companyâs director Frank John Sixt acquired 30,000 ordinary shares of CK Hutchison Holdings Limited at HK$72.4683 per share (average price), effective from August 2, 2019.
H1FY19 Key Highlights (ended on June 30, 2019): Statutory net loss for the period was reported at $157.1 Mn, reflecting $146.8 Mn increase in loss to previous year result at $10.3 Mn. HTAâs revenue from ordinary activities decreased from $5.2 Mn (pcp) to $3.2 Mn, which can be attributed to the decrease in shareholder loan balances provided to VHA which contributed lower interest income.
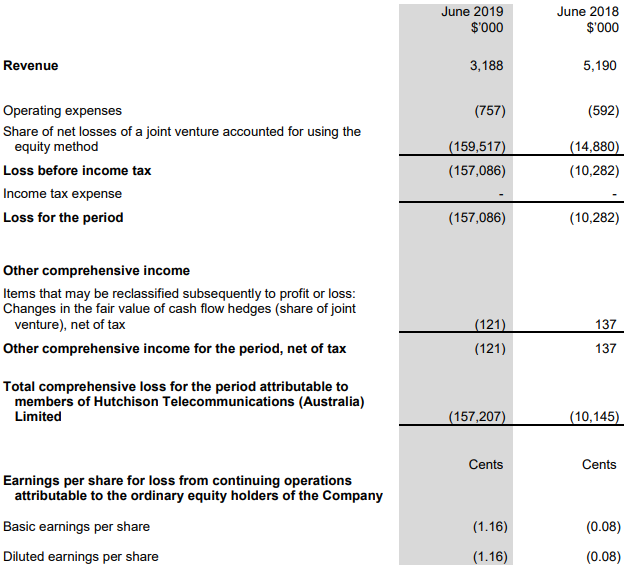
H1FY19 Income Statement (Source: Company Reports)
On the stock information front
On October 1 at 3:26 PM AEST, the HTA stock quoted $0.120 with a market cap of ~$1.63 Bn, with an annual average volume of 108,184. It has generated an absolute return of -7.69% for the last one year and -11.11% for the last six months.
MNC Media Investment Ltd (ASX:MIH)
MNC Media Investment Ltd (ASX:MIH) provides services and content to conventional and new media customers and enterprises across Singapore, Mainland China and Indonesia.
On September 5, 2019, the company updated the market about its number of Chess Depositary Instruments (CDIs). In a nutshell, it has 410,101,581 Ordinary Shares (unlisted), including Treasury Stocks, and 1,133,344 CDIs, which is equivalent to 11,333,440 ordinary shares, taking the total issued capital of 421,435,021.
FY18 Key Highlights (ended on December 31, 2018): Revenue for the period was reported at US$57 Mn, which is an increase of 6% on previous year. This was mainly due to higher sales in Family-oriented edutainment products and activities. Net loss attributable to members for the period was reported at US$9.3 Mn, as compared to US$4.7 Mn in FY17, mainly due to the increase of unrealized foreign exchange loss.
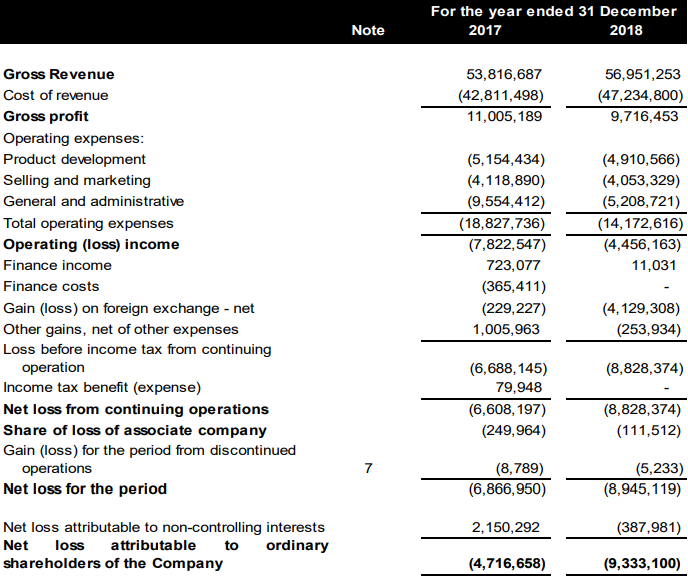
FY18 Income Statement (Source: Company Reports)
On the stock information front
On October 1 at 3:26 PM AEST, the MIH stock quoted $3.600 with a market cap of ~$1.48 Bn. Its 52 weeks high stands at $3.600. It has generated an absolute return of 138.41% for the last six months and 120.18% for the last one month.
Disclaimer
This website is a service of Kalkine Media Pty. Ltd. A.C.N. 629 651 672. The website has been prepared for informational purposes only and is not intended to be used as a complete source of information on any particular company. Kalkine Media does not in any way endorse or recommend individuals, products or services that may be discussed on this site. Our publications are NOT a solicitation or recommendation to buy, sell or hold. We are neither licensed nor qualified to provide investment advice.
