REIT stocks
The Australia based leading companies - Charter Hall Long WALE REIT, National Storage REIT and Viva Energy REIT are into property investment and funds management, that invests in the core sectors like office, retail, industrial and social infrastructure. All the three companies under discussion are on acquisitions spree and have delivered good performance in their recent results. Moreover, the Federal Government had returned to power through an election in the May 2019, implying that there is an expectation of more sound policies to be on the agenda for the next 6 to 18 months to accelerate investment in this sector.
Charter Hall Long WALE REIT
Acquisitions & Raising of Fund:
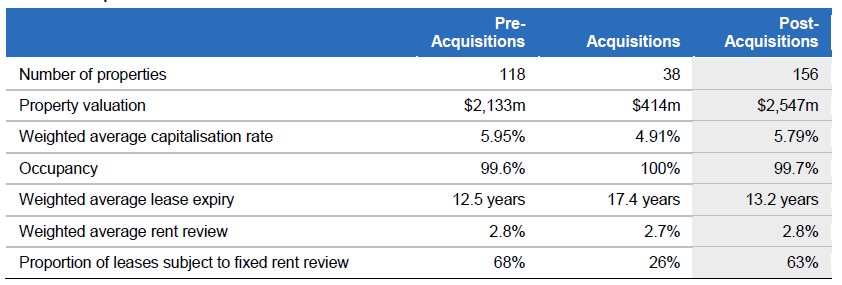
As per the presentation, released on 16 August 2019, Charter Hall Long WALE REIT (ASX: CLW) is acquiring 24.5% stake in the portfolio of 37 Telco Exchange Properties leased to Telstra Corporation Ltd (ASX: TLS) and a 100% stake in an A-grade office building in Upper Mount Gravatt, Brisbane leased to the Australian Taxation Office (ATO). These properties are of very high quality and are mostly present in the eastern seaboard markets, as well as the company will able to increase its exposure in Telstra Corporation Ltd and the Commonwealth Government. The company is acquiring these properties for an aggregate value of $413.6 million after excluding transaction costs. CLW through its partnership will acquire a 49% stake and Telstra will retain rest of a 51% stake in the property trust that holds the Telco Exchange Properties.
Further, there will be an increase in the REITâs portfolio WALE from 12.5 years to 13.2 years. CLW therefore would partially fund these acquisitions and is raising fund through equity of approximately $261 million, through a fully underwritten 1 for 13 accelerated non-renounceable entitlement offer and a fully underwritten institutional placement.
As per the companyâs release on 19 August 2019, the company has already raised approximately A$90 million via Institutional Entitlement Offer and $130 million through the placement at an issue price of A$5.20 per New Security. Through the Retail Entitlement Offer, the company will raise approximately A$41 million.
The company notified on 22 August 2019, on the retail entitlement offer front, that the Issue price is at a discount of 4.1% to the closing price of 15 August 2019, which is $5.42 and also depends on Operating EPS Yield of 5.4% for FY20. On the financial impact of the acquisitions and the offer, the company has reaffirmed the guidance for fiscal 2020 and expects FY20 Operating EPS to be of 28 cents per security which actually reflects represents annual FY20 Operating EPS growth to be of 4% on FY19. After the acquisitions and the Offer, including the impact of post balance date transactions, the company expects that pro-forma at the end 30 June 2019 will have balance sheet gearing of 25.7%, which is within the companyâs target range expected to be of 25 -35%, will have gearing of 37.1% and NTA per security to be of $4.14.

Portfolio impact (Source: Companyâs Report)
On 3 September 2019, CLWâs stock last traded at A$5.88, moving down by 0.676 percent from the last close. The company has a market capitalisation of A$2.19 billion, with 370.59 million shares outstanding. The YTD return of the stock is of 44.46 percent.
National Storage REIT
Record acquisitions in FY 19:
On 28 August 2019, National Storage REIT (ASX: NSR) released FY 19 results closed 30 June 2019.
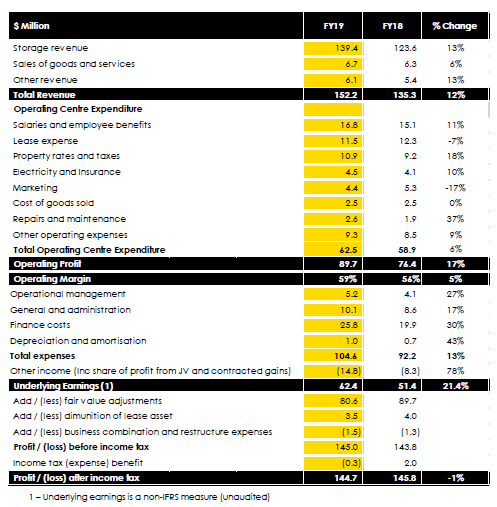
For FY 19 period, NSR has reported 21.4% increase in the underlying earnings to $62.4 million driven by record acquisitions while negotiating a softer housing market. There is 36% rise in the Investment properties to $1,949m in FY 19, where the company bought 35 facilities and settled four new development sites, of total value of more than $400 million. The company has acquired 9 storage centres and added to its New Zealand portfolio in FY 19, for a total of NZ$144 million. For FY 19, the company has reported 12% growth in the total revenue to $152.2 million, in which the company has posted 13% rise in the storage revenue to $139.4 million. Further, like-for-like revenue per available square metre has increased 0.5% to $206 in FY 19.
During FY 2019, there is 17% increase in the operating profit to $89.7 million and 5% expansion in the operating margin to 59%. The company has posted the earnings per security of 9.6¢, which is in line with guidance. However, the companyâs net profit fell 1% to $144.8 million. Further, during FY 19 the companyâs assets under management grew by 36% to $1.95 billion on the previous year. During FY 19, the occupancy in the Australian portfolio rose by 1.1 percent to 81.4 percent, and NSRâs New Zealand portfolio occupancy rose by 1 percent to 85.7% on previous corresponding period.
In FY 2019, there is an increase of 8% in NTA to $1.63 per stapled security versus $1.51 in June 2018. At the end of FY 19, the company had the cash position of $178.8m (post capital raise), debt of $868m and has funds available of $199m. The company had already raised funds through equity of $175m in August 2018 and has also raised $170m in June 2019. Moreover, the company has more than $100 million acquisition in pipeline for FY20.
For New Zealand operations, the company has 3 development projects in pipeline in Auckland and the company expects to start its construction during FY20. The company is currently concentrating on expanding in New Zealand region, increasing the already existing development pipeline and the growth of fresh and continuing joint venture arrangements. For fiscal 2020, the company expects distribution to have greater than 4% growth per stapled security, underlying EPS to grow by 4% to 10 cents per security and underlying earnings growth to be greater than $78 million.

FY 19 Financial Performance (Source: Companyâs Report)
On 3 September 2019, NSRâs stock, by the end of the trading session, was at A$1.81, down by 1.362 percent from the last closing price. The company has a market capitalization of A$1.43 billion, with 781.26 million shares outstanding. The stock for the YTD period provided a return of 3.97 percent.
Viva Energy REIT
Decent Growth in 1H FY 19:
On 22 August 2019, Viva Energy REIT (ASX: VVR) declared half-year results closed 30 June 2019.
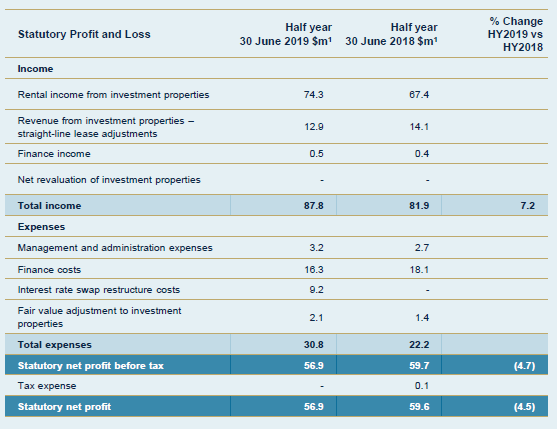
For the first half of FY 19 has reported 7.2% increase in the statutory total income to $87.8 m, in which the rental income from investment properties grew to $74.3 m from $67.4 m in 1H 2018. The growth in the rental income is on the back of fixed escalators (mostly 3%) and also due to part-period contributions from the acquisition of 18 properties.
VVR in 1H 2019 has posted decline in finance costs to $16.3 m from $18.1 m in 1H 2018 on the back of by the repayment of debt from the funds raised through equity (in 2019 the company had raised $115.6 m of new equity). The company for the first half of FY 19 has reported 4.5% fall in the statutory net profit to $56.9 m.
During 1H 2019, there has been 2.7% increase in Distributable Earnings per security versus 1H 2018. The company at the end of 1H 2019, had cash and cash equivalents of $21.8 m, however its NTA had fallen by 0.4% during the period.
Moreover, for FY 19, the company expects earnings to grow in the range of 3% to 3.75%. The company expects 2019 Distributable Earnings per security to grow in the range of 3 3.75% from 14.02 CPS in FY 18 and the company is targeting payout ratio to be 100% of Distributable Earnings.
Additionally, the New CEO, Hadyn Stephens, is expected to join the company during September 2019.

VVRâs Statutory 1H FY 19 Financial Performance (Source: VVRâs Report)
VVRâs stock, by the closure of the market session, on 3 September 2019, was at A$2.93, down by 1.347 percent compared to the last close. The company has a market capitalization of A$2.31 billion, with 778.69 million shares outstanding. The YTD return of the stock is of 30.84 percent.
Disclaimer
This website is a service of Kalkine Media Pty. Ltd. A.C.N. 629 651 672. The website has been prepared for informational purposes only and is not intended to be used as a complete source of information on any particular company. Kalkine Media does not in any way endorse or recommend individuals, products or services that may be discussed on this site. Our publications are NOT a solicitation or recommendation to buy, sell or hold. We are neither licensed nor qualified to provide investment advice.


