


Letâs look at a few stocks engaged in activities related to the properties or real estate. These trusts have recently come up with their Annual Reports for the respective period.
BWP Trust (ASX:BWP)
BWP Trust (ASX: BWP) is engaged with property investments throughout Australia and derives rental income from investments in commercial warehouse properties, mainly Bunnings Warehouses, leased to Bunnings Group Limited. BWP Management Limited manages the Trust, in turn, based on the gross assets of the Trust receives a quarterly fee. Wesfarmers Limited (ASX: WES) has wholly-owned subsidiaries Bunnings and BWP Management Limited. WES holds ~24.75% stake in BWP via one of its subsidiaries.
The company recently released an Annual Report for the financial year ended 30th June 2019.
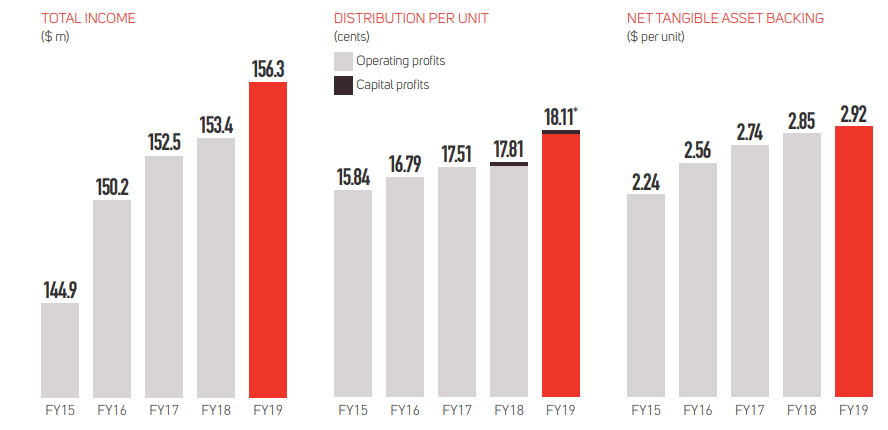
FY19 Results Highlights: Like-for-like (LFL) rental growth for FY19 came in at 2.3%, higher than average CPI inflation linked leases of 1.9%. The Trust saw net revaluation gains on the property investment portfolio of $53.4 million for the year. The portfolio was leased 97.4% with a weighted average lease expiry of 4.4 years at 30th June 2019. NTA (Net tangible assets) was up 2.5% to $2.92 per unit at 30th June 2019 as compared to $2.85 per unit in FY18. Final distribution for FY19 came in at 9.18 cents, bringing the full-year distribution to 18.11 cents, up 1.7% on Y-o-Y. Special distribution of 1.56 cents was declared during the period.
Key Financial History (Source: Company Reports)
At the current market price of $3.760 (AEST 01:13 PM, 7th August 2019), the stock is available at a price-to-earnings multiple of 15.230x, with an annual dividend yield of 4.82% and a market capitalisation of $2.42 billion. The 52-week trading range for the stock comes in at $3.187 - $3.935 and currently, inching towards the higher end of the range. The stock has gained 14.05% in the last one year.
SCA Property Group (ASX:SCP)
SCA Property Group (ASX: SCP) invests in and manages shopping centres in Australia. The company recently shared its annual report with the market for the year ended 30th June 2019.
The investment portfolio at the end of FY19 comprised of 85 shopping centres valued at $3,147.0 million as compared to 77 shopping centres in FY18 valued at $2,453.8 million ($57.9 million held for sale). The group also managed 11 properties valued at $184.3 million for three unlisted retail funds in FY19 as compared to seven properties valued at $126.1 million for two unlisted retail funds in FY18. During FY19, the Group acquired 12 properties for the value of $677.9 million (ex-transactions costs).
Financial highlights for FY19:
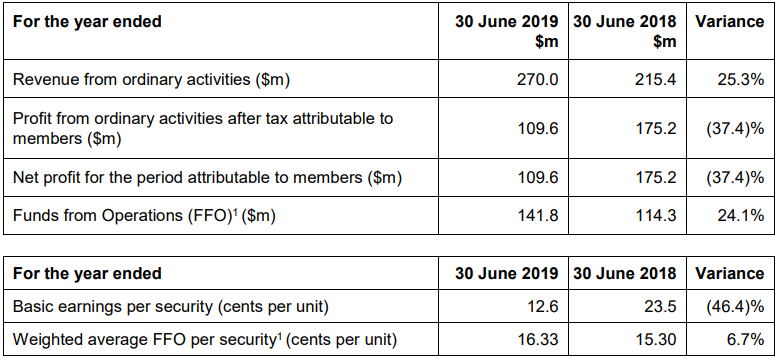
Statutory NPAT (net profit after tax) for FY19 stood at $109.6 million with a decline of 37.4% Y-o-Y, mainly on account of transaction costs related to the acquisitions and reduced investment property valuation uplift. FFO (Funds from Operations) came in at $141.8 million, up 24.1% on Y-o-Y with FFO per unit at 16.33 cents, up 6.7% on FY18. Distribution for FY19 at 14.70 cpu was up 5.8%, with a payout ratio of 90%. The weighted average cost of debt was 3.6% annually with a gearing of 32.8% in FY19, which was up from 31.2% at 30th June 2018. NTA (Net tangible assets) for FY19 was $2.27 per unit at the end of FY19, down by 1.3% from $2.30 as at 30th June 2018. MER (Management Expense Ratio) of 0.37% in FY19 was down from 0.43% in FY18.
FY19 Financial Snapshot (Source: Company Reports)
Going forward, the Group has guided FY20 FFO per unit to come in at 16.70 cpu (2.3% above FY19 actual). The Management has also projected FY20 distribution per unit to be at 15.10 cpu, 2.7% above FY19 actual.
At the current market price of $2.520 (AEST 01:20 PM, 7th August 2019), the stock is available at a price-to-earnings multiple of 13.290x, with an annual dividend yield of 5.81%. The stock has gained ~3.69% in the last one year.
Centuria Industrial REIT (ASX:CIP)
Centuria Industrial REIT (ASX: CIP) is a registered managed investment scheme domiciled in Australia with the principal activity of investing in industrial properties within the country. The Trust recently released its Annual Report for the period ended 30th June 2019.
Financial Highlights for FY19:
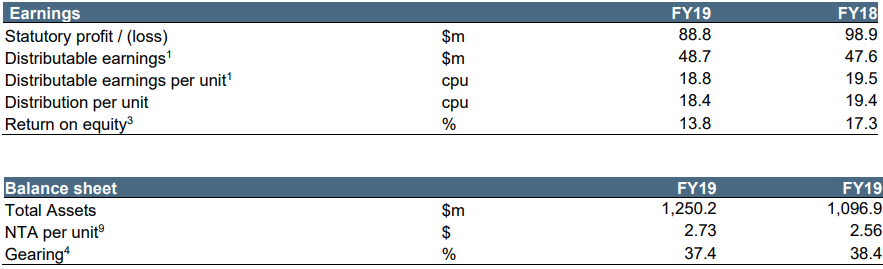
The Trust reported a statutory profit of $88.8 million in FY19 as compared to $98.9 million in FY18. Distributable earnings came in at $48.7 million with distributable earnings per unit coming in at 18.8 cents in FY19 when compared with FY18 distributable earnings of $47.6 million and distributable earnings per unit of 19.5 cents. Return-on-equity for the period stood at 13.8%.
FY19 Financial Results (Source: Company Reports)
FY19 Portfolio Highlights:
During the period, leases agreed for more than 113,000 sqm, represented 14% of the total portfolio. Occupancy for the portfolio went up to 95.9% with a WALE of 4.3 years. Value of the portfolio saw an increase to $1.2 billion during FY19. Total transactions in FY19 stood at $203.7 million with an improved portfolio quality.
At the current market price of $3.170 (AEST 01:30 PM, 7th August 2019), the stock is available at a price-to-earnings multiple of 8.230x, with an annual dividend yield of 5.82%, and a market capitalisation of $928.4 million. The stock has gained ~21% in the last one year.
Viva Energy REIT (ASX:VVR)
Viva Energy REIT (ASX: VVR) invests in service station property. The trust preserves a portfolio of 454 freehold service station properties, which are situated throughout Australia and mainland territories. The properties have been leased to Viva Energy Australia Pty Ltd, fuel operators and others.
Recent Updates:
- The company recently notified that Commonwealth Bank of Australia and its related bodies corporate ceased to be a substantial holder in it.
- The company advised about the results for the second half of FY19, which are scheduled to be announced on 22nd August 2019.
- VVR recently announced an ordinary dividend of $0.07180 (110% unfranked) with a payment date of 29th August 2019.
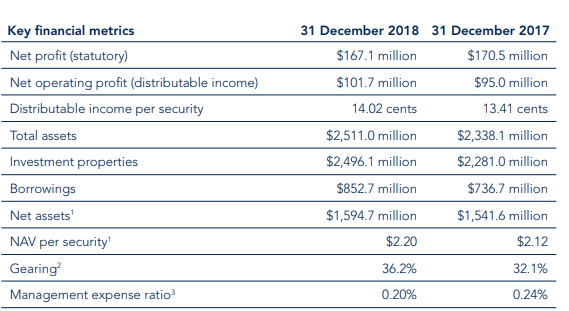
Financial Highlights of FY18: VVR recorded a statutory net profit of $167.1 million during the period with distributable earnings at $101.7 million, equating to 14.02 cents per security, up 4.5% from FY17. Property revaluations posted a rise in property valuations of $43.6 million with NTA (net tangible asset) per security to $2.201, a rise of 3.8% from December 2017. VVR delivered a 10.4% underlying property return in 2018. The Trust continued to manage the costs and operating expenses with MER of 20 bps, down from 24 bps in FY17.
Coming to the Capital Management, VVRâs gearing at the end of FY18 came in at 36.2% as compared to 32.1% in FY17, within the stated gearing range of 35% to 45%. The Trust retains significant headroom to make further acquisitions, consistent with its stated investment criteria.
In FY18, the Trust saw a rise in debt facilities, lengthened debt tenure and diversified sources of capital, in line with the Trustâs strategy. Drawn debt by the trust stood at 93.4%, hedged for a weighted average of 3.8 years at 31st December 2018.
Financial Highlights 2018 (Source: Company Reports)
Property Overview: VVR, being the largest listed REIT of Australia, comprises solely service station and convenience properties. At the end of FY18, the portfolio consisted of 454 properties valued at $2.5 billion and a weighted average capitalisation rate of 5.8%. The high-quality, diversified portfolio has been assembled over the last 100 years with a coverage of 2.11 million sqm of real estate. 75% of properties in terms of valuation are situated in the metropolitan areas of Australia. Occupancy for the period was 100% with a fixed 3% per annual rental increases and long-term triple net leases to Viva Energy Australia.
At the current market price of $2.590 (AEST 01:45 PM, 7th August 2019), the stock is available at a price-to-earnings multiple of 11.29x, with a market capitalisation of $2.02 billion and an annual dividend yield of 5.08%. The stock has gained ~18% in the last one year and currently, inching towards the higher end of its 52-week range.
Disclaimer
This website is a service of Kalkine Media Pty. Ltd. A.C.N. 629 651 672. The website has been prepared for informational purposes only and is not intended to be used as a complete source of information on any particular company. Kalkine Media does not in any way endorse or recommend individuals, products or services that may be discussed on this site. Our publications are NOT a solicitation or recommendation to buy, sell or hold. We are neither licensed nor qualified to provide investment advice.
