


_06_16_2026_01_38_04_856127.jpg)

Undervalued stocks are generally considered those stocks which have a low P/E multiple as compared to their peers. These stocks are cheap and have low prices in the market. Finding these stocks is not easy, as market generally value the stocks at their fair values. Companies with low P/E and a strong moat can be considered as an icing on the cake. , Moat, itâs a business capability to retain its competitive advantage that the company has, (comma missed) due to which its market share, profit, top line etc, would not get impacted by the business strategies and execution of its competitors.
We discuss a few undervalued stocks with good moat.
Telstra Corporation Limited
About the company: Telstra Corporation Limited (ASX: TLS) is Australiaâs technology and telecommunication company, which also offers a wide range of communication services. The company majorly operates in Australia and have more than 350 retail stores. It delivers 3.7 million retail fixed bundles, 18.3 million retail mobile services and 1.4 million retail voice services. The market capitalization of the company stood at A$42.7 billion as on 13th September 2019.
Changed guidance for FY20 due to NBN Corporate Plan 2020: Telstra has changed its guidance for FY20, after the release of NBN Coâs Corporate Plan 2020. NBN Coâs Corporate Plan 2020 gave an updated information of the companyâs outlook for FY20 which stated a reduction in the total number of premises forecast, which were supposed to be connected in FY20. The number decreased from 2 million to 1.5 million, a drop of 25%. These 500,000 reductions will be a divided into two parts- 400,000 less brownfield premises and 100,000 less Greenfield premises which were supposed to be connected in FY20.
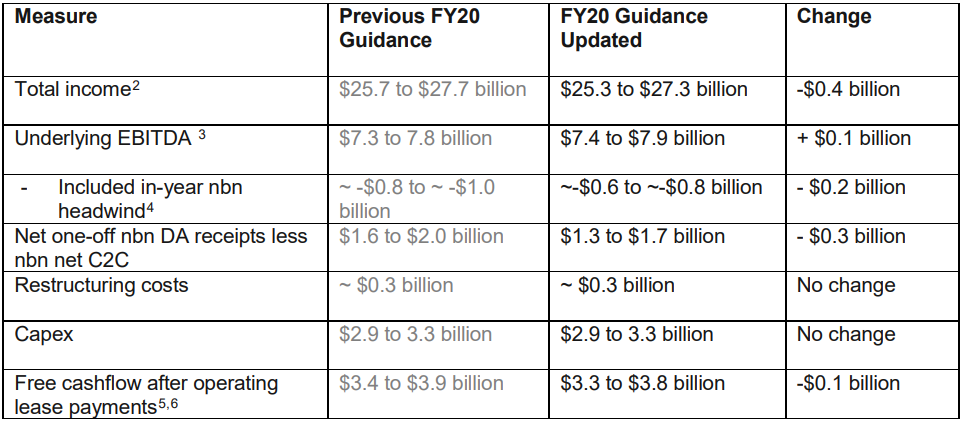
Source: Company Report
Financial Highlights: The company reported a decline in revenue of 3.6% in FY19 to $27.8 billion. Reported EBITDA also declined by 21.7% to $8.0 billion. The NPAT of the company declined by 39.6% to $2.1 billion. The total estimated impact of the recurring headwind that the company has incurred due to nbn on EBITDA is approximately $1.7 billion from FY16 to FY19.
Stock Performance: On 13th September 2019, TLS stock last traded A$3.610, moving up by 0.557 percent from the prior close. In the last six months period, the stock has generated a positive return of 12.04 percent. The stock has a P/E multiple of 19.830X.
TPG Telecom Limited
About the company: TPG Telecom Limited (ASX: TPM) is an Australian telecommunication company. It provides internet to consumers and businesses. The company also provides mobile telephone services. The market capitalization of the company stood at A$6.51 billion as on 13th September 2019.
FY19 results highlights: The company reported revenue of $2,477.4 million in FY19 which was flat as compared to revenue to FY18. Underlying EBITDA was down by 1% to $818.4 million. NPAT of the company declined by 13% to $173.8 million. The results of TPM were deeply impacted by the Companyâs choice to stop the rollout of its Australian Mobile network in January 2019, due to which impairment cost of $236.8 million was created and there was a significant increase in amortisation and interest expense.
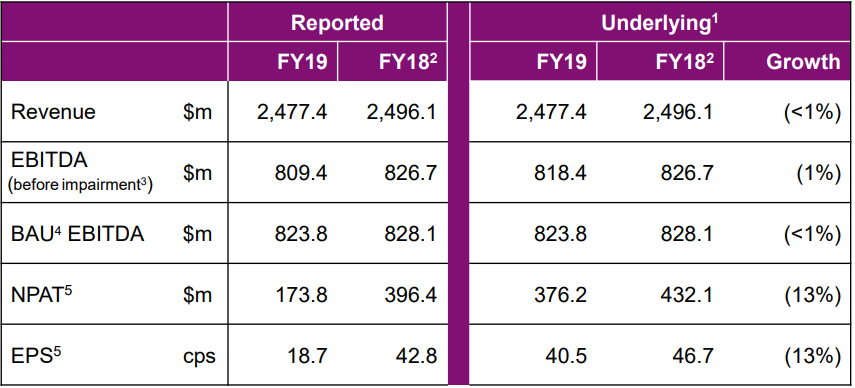
Financial Highlights of the company Source: Companyâs Presentation
Financial position of the company: The companyâs net operating cash flow before tax were very strong and above the EBITDA at $836.3 million. By the end of FY19, the company had a net debt of $1.94 billion which shows a leverage ratio of 2.4X underlying FY19 EBITDA.
Capex in FY19: The total capital expenditure in FY19 stood at $717.3 million which included $352.4 million instalment for 2*10 MHz of 700Mhz spectrum, which was acquired at auction in 2017, $86.1 million invested to build Australian mobile network and another $80.1 million invested to build Singapore mobile network.
Stock Performance: On 13th September 2019, TPM stock closed at A$7.100, up by 1.14 percent from the prior close. In the last six months period, the stock has generated a positive return of 3.54 percent. The stock has a P/E multiple of 37.540X.
Vocus Group Limited
About the company: Vocus Group Limited (ASX:VOC) is a telecommunications services provider. The company has a widespread national infrastructure network of metro and back haul fibre joining all capital cities. The market capitalization of the company stood at A$2.14 billion as on 13th September 2019.
Resignation of company secretary: Ashe-lee Jegathesan, has resigned as the company secretary. Simon Lewin will take charge from 25th September 2019.
Business Performance: Company reported a good set of numbers for FY19 with major revenue coming from Companyâs core business. Recurring revenues were up by 5%, total revenue grew by 23% and underlying EBITDA increased by 5% during the year. Major revenue growth in recurring segment was seen from State and Federal Government business, demand was mainly coming from Australian Singapore Cable and good performance was seen in the Wholesale business.
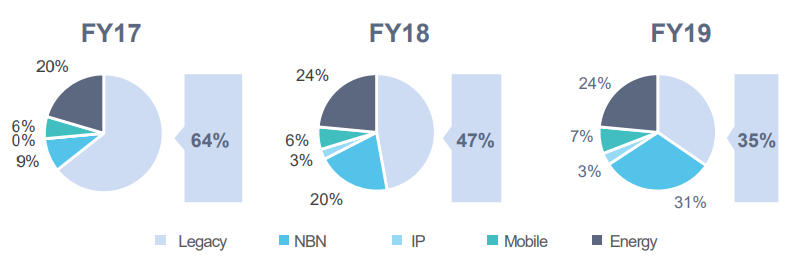
Revenue Contribution from various segments Source: Companyâs Presentation
Important highlights in the results:
- Results were in line with the guidance given;
- Companyâs core business, Vocus Network Services, showed a growth of 5% in recurring revenue;
- In the Retail Business, unit margins saw improvement due to cost reductions;
- Vocus New Zealand showed good performance and its revenue grew by 4.5% and EBITDA by 2.5%.
Outlook for FY20: The underlying EBITDA is estimated in between $359 million to $379 million. Cash conversion would be between 90-95% and capex would be between $200-$210 million.
Stock Performance: On 13th September 2019, VOC stock closed at A$3.490, moving up 1.453 percent from the prior close. In the last six-month period, the stock has generated a negative return of 5.23 percent. The stock has a P/E multiple of 62.890x.
REA Group Limited
REA Group Limited (ASX: REA) is a multinational business. It specialises in property. The market capitalization of the company stood at A$13.81 billion as on 13th September 2019.
Results Highlights for FY19: The company reported a revenue growth of 8% to $874.9 million due to increase in Australian business. Residential and Developer businesses showed strong performance for the year, particularly in the second half. The residential listing in Australia decreased this year by 8%. Sydney and Melbourne saw major declines in residential listings at 18% and 11% respectively.
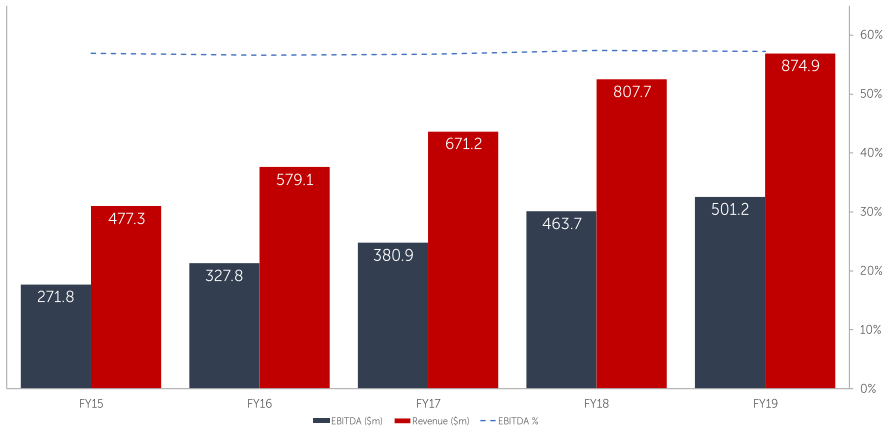
Financial Performance of the company Source: Companyâs Presentation
Dividend: The company declared a final dividend of 63 cents per share, fully franked. This makes the total dividend for the year at 118 cents per share, 8% increase from the previous year.
Outlook for FY20: The company expects the listing for the first half would be lower than that in the last year, due to favourable environment in 1H FY19. As a result, revenue growth will be majorly tilted towards the second half. The companyâs costs will remain flat on a Y-o-Y basis.
Stock Performance: On 13th September 2019, REA stock closed at A$105.950, up by 1.02 percent from the prior close. In the last six months period, the stock has generated a positive return of 29.50 percent. The stock has a P/E multiple of 131.590x.
CYBG PLC
About the company: CYBG PLC (ASX: CYB) is an autonomous banking group. The market capitalization of the company stood at A$3.16 billion as on 13th September 2019.
Increase in Legacy PPI costs: The company raised its provision for PPI costs, to £300 million - £450 million. This happened primarily because of unprecedented volume of PPI Information Requests received during August 2019.
Financial highlights for 1H19: Company reported a decrease in pro forma, underlying PBT of 5%, YoY to £286 million due to increase in impairments. Company reported pro-forma, underlying Return on Tangible Equity (ROTE) of 10.4%. Pro forma PBT came at £9 million, impacted by significant acquisition and integration costs.
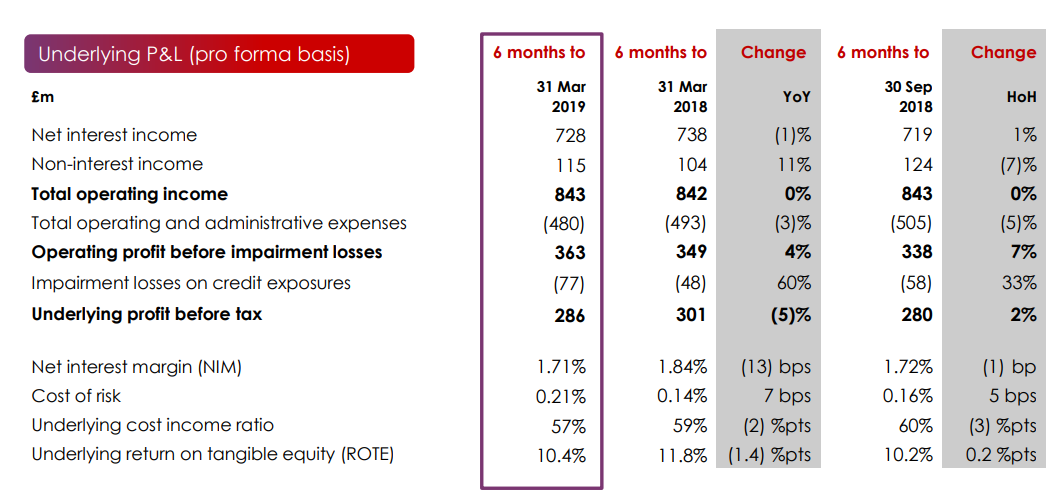
Financial Performance Source: Companyâs Presentations
Underlying costs decreased by 3% YoY to £480 million, the underlying cost to income ratio was 2% lower at 57%.
Good customer growth: Company witnessed customer lending growth of 2.4% to Pound 72.7 billion mainly due to:
- Sustainable mortgage balance growth of 2.5% to Pound 60.5 billion;
- SME growth of 1.1% to Pound 7.6 billion;
- Unsecured balances were up by 4.2% to Pound 4.5 billion due to good growth from Virgin Atlantic credit cards.
Stock Performance: On 13th September 2019, CYB stock closed at A$2.180, down 0.909% from its prior close. In the last six months period, the stock has generated a negative return of 41.18 percent.
Disclaimer
This website is a service of Kalkine Media Pty. Ltd. A.C.N. 629 651 672. The website has been prepared for informational purposes only and is not intended to be used as a complete source of information on any particular company. Kalkine Media does not in any way endorse or recommend individuals, products or services that may be discussed on this site. Our publications are NOT a solicitation or recommendation to buy, sell or hold. We are neither licensed nor qualified to provide investment advice.
