


The hot trio of gold, bitcoin, and crude oil are showing some development on charts after completing a significant move recently.
In the status quo, post shattering the seven-year high gold prices have somewhat halted the ongoing rally around long-term resistance levels, which coupled with many other developments is now turning into some interesting chart patterns on charts.
To Know More, Do Read: Gold Shatters 7-Year High, Joy Ride Coming For ASX-listed Gold Stocks?
On the contrary, crude oil prices are recovering slightly after reaching all-time record low with WTI crude oil even falling below 0 to trade in negative territory.
To Know More, Do Read: WTI Crude Oil Price Drops to Record Lows of Sub-zero levels
Gold Rally Halts Around Major Resistance
- Gold Spot On Charts
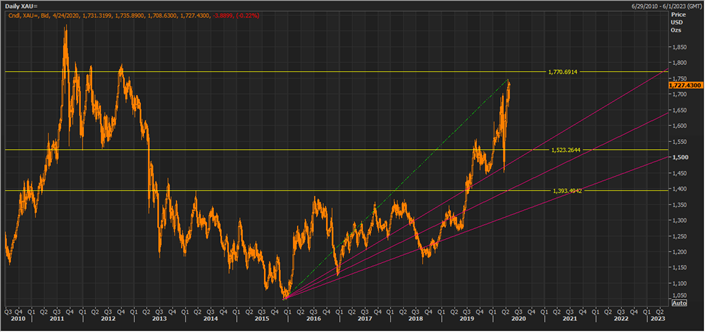
XAU Daily Chart (Source: Thomson Reuters)
On the daily chart, it could be seen that after a significant rally, the gold spot is now trying to test the long-term resistance line of ~ USD 1,770.70, and investors should monitor the level closely as a break and sustain above the same with decent volume could support the price ahead, while failure to do so could bring in some correction.
On further projecting the Fibonacci support fan from the recent low to the recent high, it could be seen that while correcting previously, the gold spot took the support of the 3/3 fraction of the support line, which should now act as the short-term support level for gold, which is near the psychological support.
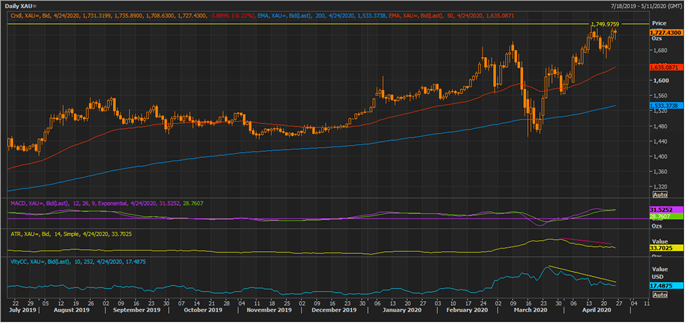
XAU Daily Chart (Source: Thomson Reuters)
On further analysing the daily chart, it could be seen that that spread between the fast-line and slow-line in the moving average convergence divergence or MACD indicator is narrowing down, which coupled with lower average true range and close-to-close volume suggest that gold could face some pressure, while it attempts to breach its long-term resistance line.
Also, it should be noticed that, while in the recent times, gold spot has shown a decent rally, both the leading indicators are showing negative divergence with the price.
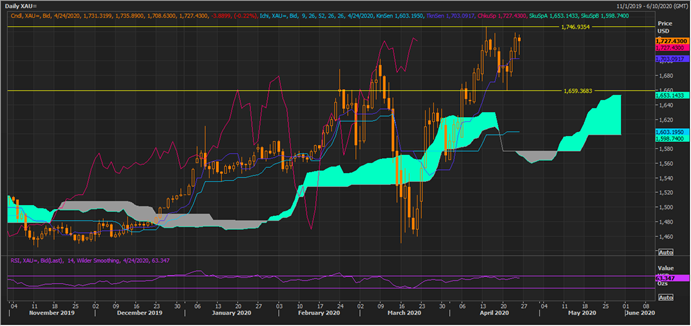
XAU Daily Chart (Source: Thomson Reuters)
On horizontally connecting the long-term support and resistance level, it could be seen that gold spot is currently trading between them, if the prices retrace from here it could form a potential double top, which is yet pending any confirmation. The price pattern, which is visually resembling a double top would be confirmed if the spot reaches below the neck of the pattern or the support line at ~ USD 1,659.37.
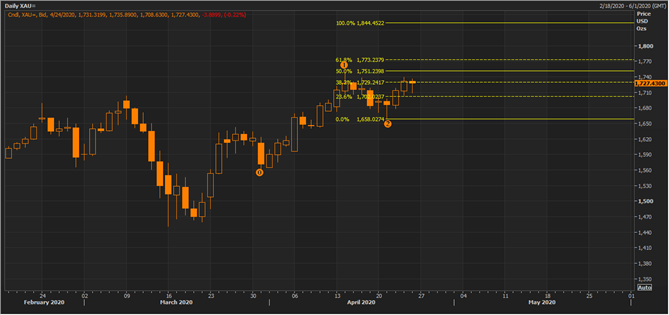
XAU Daily Chart (Source: Thomson Reuters)
The Fibonacci projections for the wave point marked as 0,1, and 2 is as above, and currently the gold spot is testing the 38.2 per cent of the projected level.
- Crude Oil On Chart
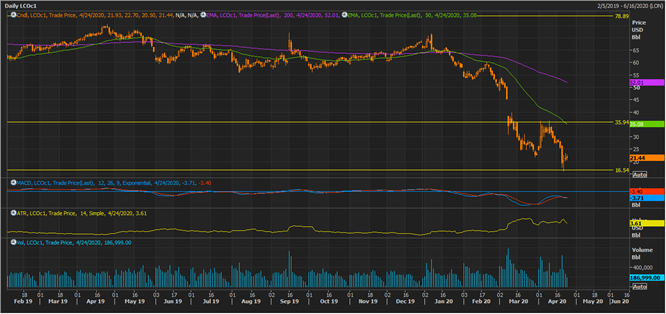
LCO Daily Chart (Source: Thomson Reuters)
On the daily chart, it could be seen that the crude oil is now recovering slightly post testing its long-term support level of ~ USD 16.50. While prices are moving slightly up with the MACD showing a negative signal, and coupled with a falling average true range and volumes, setting an overall bearish set-up.
The spread between the long-term (200-day) exponential moving average and the short-term (50-day) exponential moving average is enlarging with a negative crossover, reflecting strength in the current downtrend.
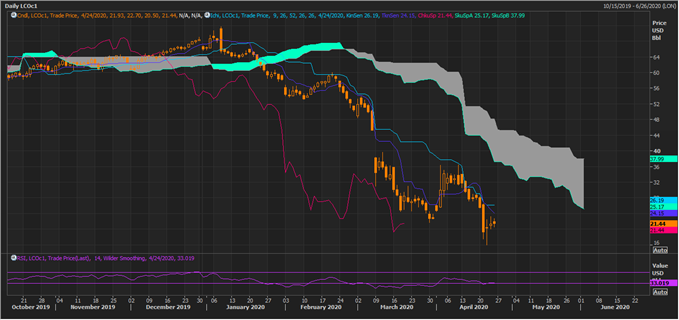
LCO Daily Chart (Source: Thomson Reuters)
On applying the Ichimoku cloud on the daily chart, it could be seen that crude oil prices are currently trading below Span A or the mean value of the conversion line and the base line. The conversion line or the dark blue line, which denotes the mean value of 9-day high and low is showing a negative cross with the base line (sky blue), which denotes the mean value of 26-day high and low.
The spread between Span A and Span B (or the mean value of 52-days high and low) is enlarging with a negative cross between the conversion and the base line below Span A, suggesting that the downtrend is having more steam left.
The 14-day RSI is behaving in tandem with the price action and is currently below the mean value and above the oversold zone.
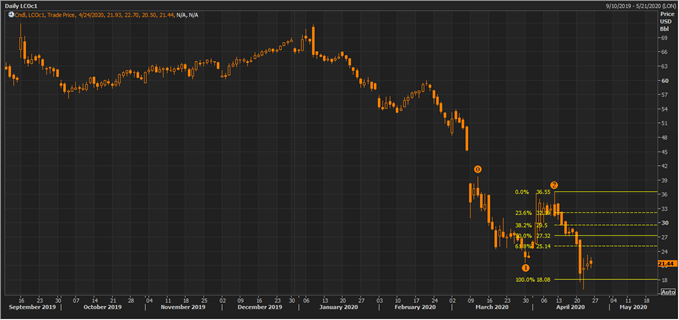
LCO Daily Chart (Source: Thomson Reuters)
The Fibonacci projections for the wave point marked as 0,1, and 2 is as above, and recently crude oil prices took the support of the 100.0 per cent of the projected level and now moving to test the 61.8 per cent of the projected resistance.
Also Read: Oil Crisis: Should you Buy or Sell Some Oil Stocks?
- Bitcoin On Charts
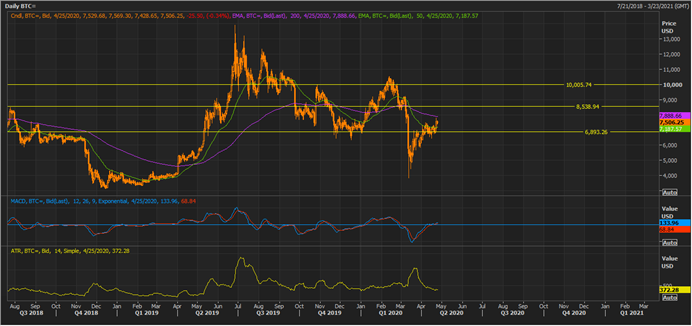
BTC Daily Chart (Source: Thomson Reuters)
On the daily chart, bitcoin prices are trading in a narrow range of its long-term support and resistance level and also testing the 200-day exponential moving average. Currently, the MACD is giving a positive signal, while the average true range of the currency is falling, while prices trying to test its long-term resistance level, reflecting that the level of ~ USD 8,539.00 holds significance, and investors should monitor the level closely as a break and sustain above the same with decent volume could mark the continuation of the primary uptrend.
On the downside, the support is intact at ~ USD 6,894, which was breached previously but the currency is taking another attempt to sustain around the support, which should be monitored ahead as a break below again the same support with decent volume could mark the continuation in the ongoing correction of the primary uptrend.
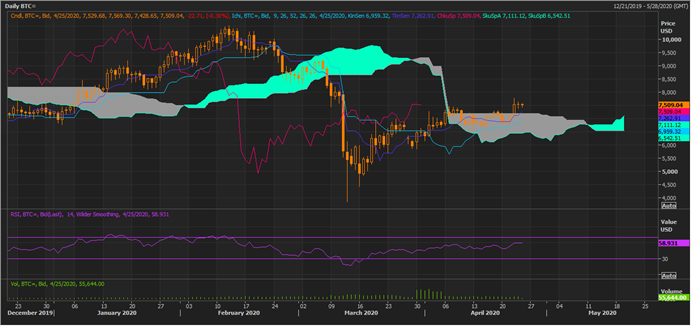
BTC Daily Chart (Source: Thomson Reuters)
On further applying the Ichimoku clouding technique on the daily chart, it could be seen that the currency has moved above Span A with a positive crossover between the conversion line and the base line. Now, the grey cloud area would serve as the support zone for the currency. Also, the spread between Span A and Span B is now enlarging, suggesting that bulls are now gaining slight strength.
Also Read: Bitcoin Testing Multiple Resistance Zones, While Potential Bearish Flag Emerges on Daily Chart

BTC Daily Chart (Source: Thomson Reuters)
The Fibonacci projections for the wave point marked as 0,1, and 2 is as above, and recently bitcoin prices tested the 38.2 per cent of the projected level and retraced back; however, the currency is again taking an attempt to test the same level.
