


Gold prices took a deep hit yesterday, with gold spot falling from the level of USD 1,494.26 (Dayâs high on 6 October 2019) to the level of USD 1,460.66 (Dayâs low on 7 October 2019), which marked a drop of over 2.20 per cent. The ASX-listed gold stocks responded correspondingly to the fall in gold prices during the session today on ASX.
ASX gold stocks were in a rally for a while until recently; however, the positive trade talks between the United States and China are currently putting pressure on gold as trade optimism builds hope in the market for better returns from the riskier assets.
In the recent address to media, the premier Chinese officials mentioned that China is holding the tariff against the United States to further promote the phase one of the trade deals, which further exerted pressure on the gold in the international market.
Dollar prices skyrocketed in the market, and dollar index rose from the level of 97.11 (Dayâs low on 1 November 2019) to the high of 98.23 (Dayâs high on 7 November 2019), which underpinned a price increase of over 1.15 per cent.
The market discount rate or the bond yields on the 10-year U.S. bonds spiked sharply from the level of 1.670 per cent (Dayâs low on 1 November 2019) to the level of 1.973 (Dayâs high on 7 November 2019).
The rise in risky assets such as dollar, coupled with a fall in the safe havens such as the bonds exerted pressure on gold, which rallied downward from the level of USD 1,516.06 (Dayâs high on 1 November 2019) to the level of USD 1,460.66 (Dayâs low on 7 November 2019), which marked a fall of over 3.65 per cent in the international market.
Gold on Charts
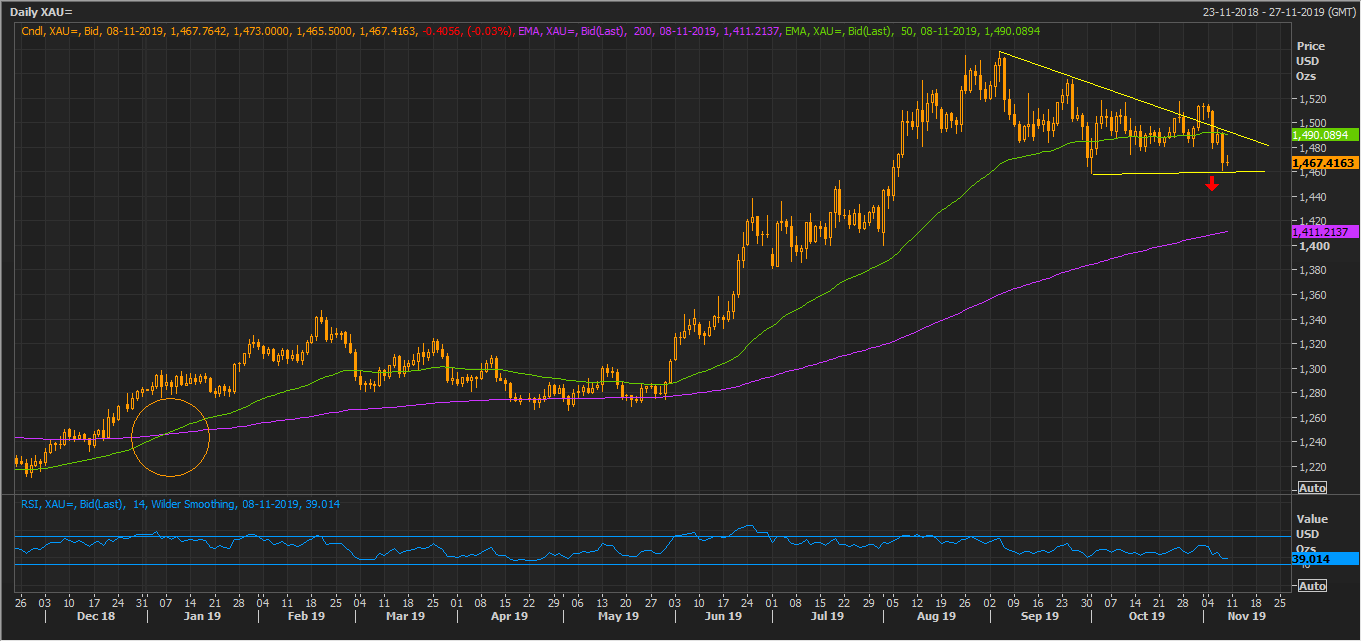
XAU Daily Chart (Source: Thomson Reuters)
On the daily chart, gold prices are trading below the 50-day exponential moving average, which is at USD 1,490. The 50-day EMA could act as a hurdle for the gold prices.
The gold prices are currently trading at the crucial support level of around USD 1,460 per ounce. If the prices sustain the current level with higher closing volume, it could support the prices again to retest the 50-Day EMA; otherwise, a break below USD 1,460 with good volumes could further exert pressure on gold.
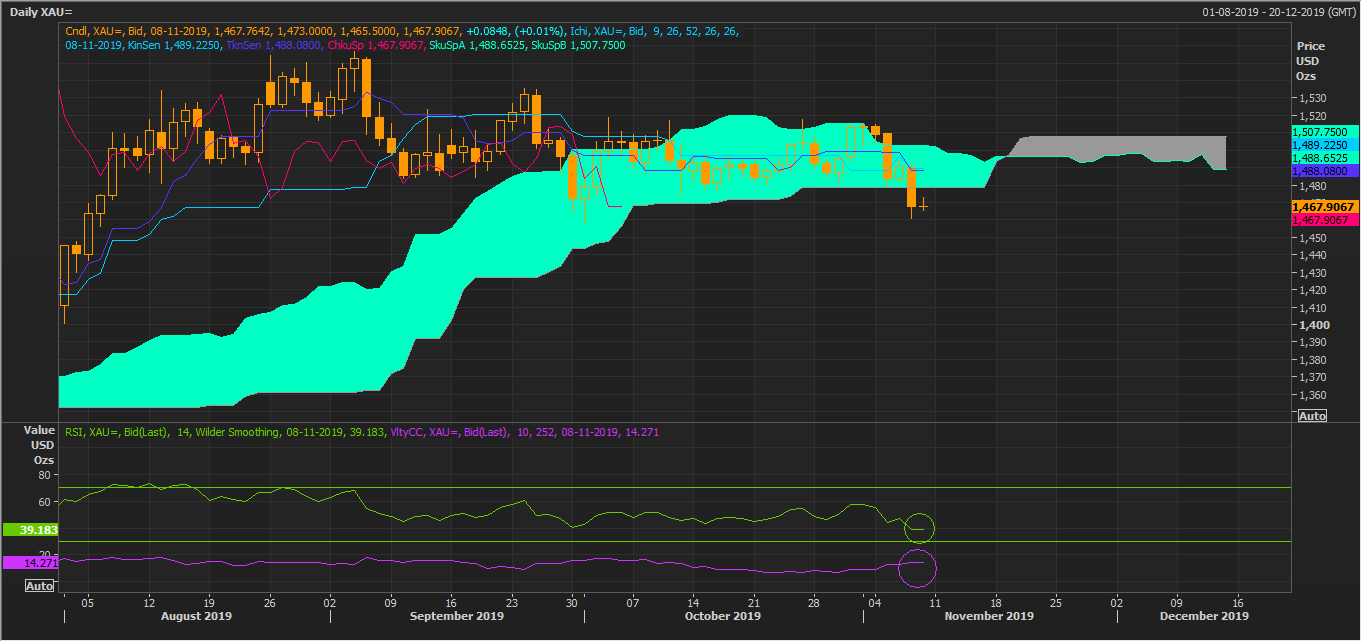
XAU Daily Chart (Source: Thomson Reuters)
The prices are now trading below the Span A of Ichimoku, which derive its value from the mean of the conversion line (navy blue) and the base line (sky blue). The Span A is widening its gap from Span B, which is the mean of 52-day high and low, which further suggests, that the downward trend is taking strength.
The closing volume, at the end of each day, is witnessing an increase, which in the scenario of the falling prices further suggesting that the net shorts are holding the position in expectation of a further fall; however, It is not mandatory, but coupled with the below mean 14-days Relative Strength Index the increase in closing volume is favouring the assumption.
The downside Fibonacci projections for gold on the daily chart from the coordinates marked as 0,1 and 2 are as below:
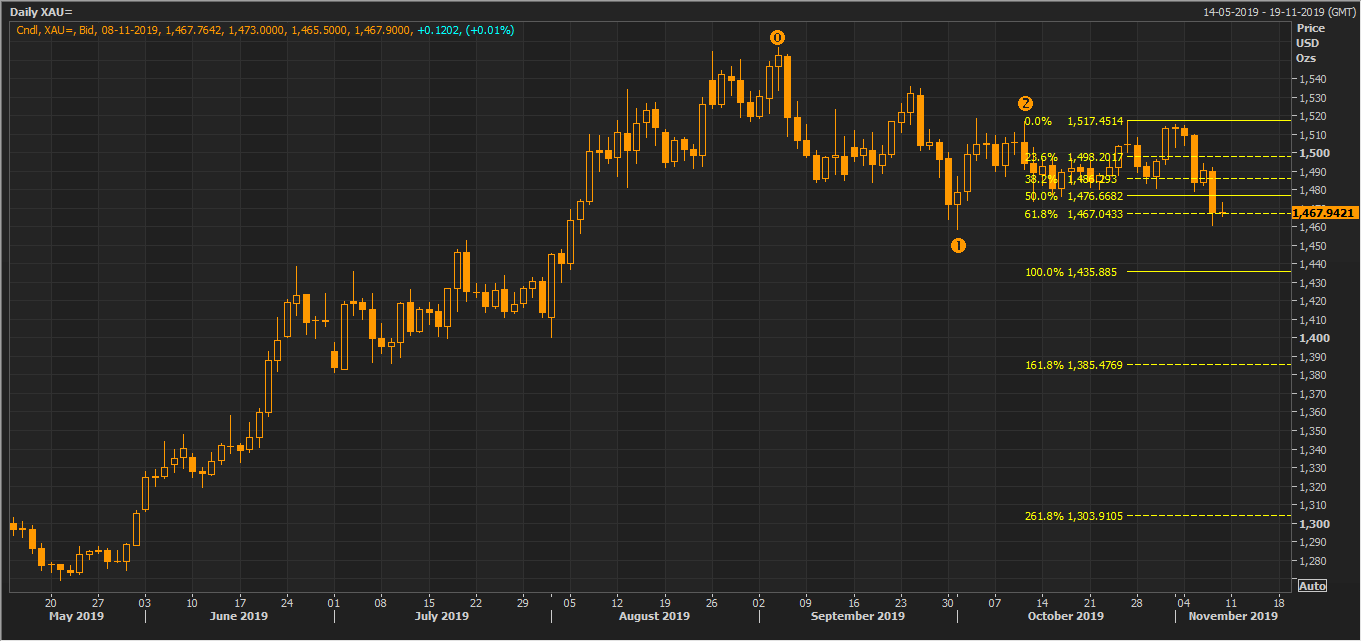
XAU Daily Chart (Source: Thomson Reuters)
While the gold prices are tumbling in the international market, the ASX-listed gold stocks are also under pressure.
ASX-listed Gold Stocks
Resolute Mining Limited (ASX: RSG)
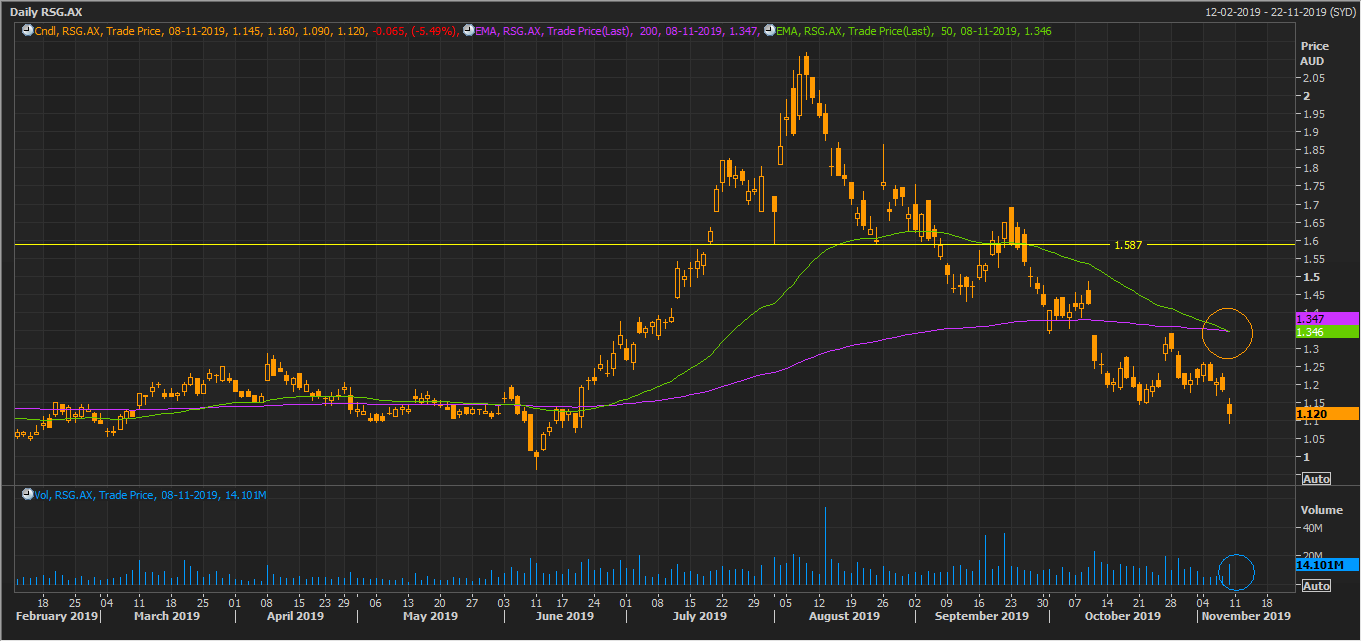
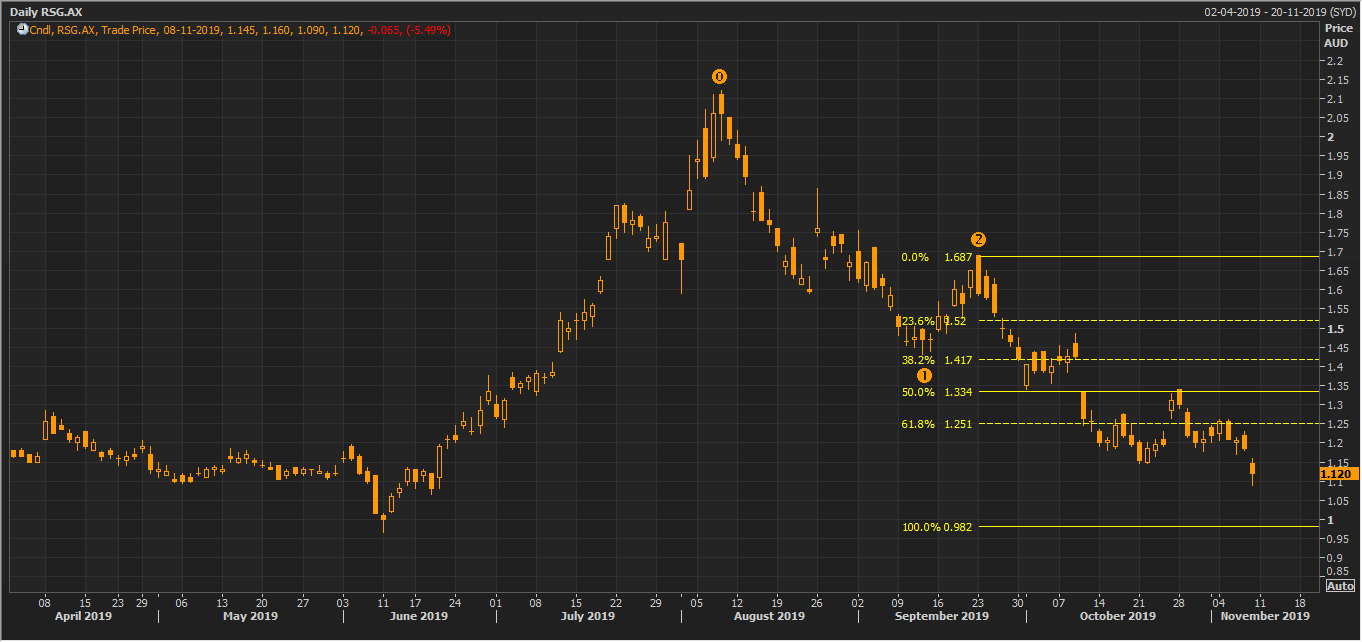
RSG Daily Chart (Source: Thomson Reuters)
Post witnessing a classic Head & Shoulder (H&N) pattern, the stock fell to meet the downside target. However, in the status quo, RSG remains under pressure, and the stock is trading below the 50- and 200-days EMAs with 50-day EMA trying to cross the 200-day EMA from above to establish a death crossover (bearish crossover).
Further fall in the stock and a lower close could establish a negative crossover, which could further exert pressure on the RSG over the short-run.
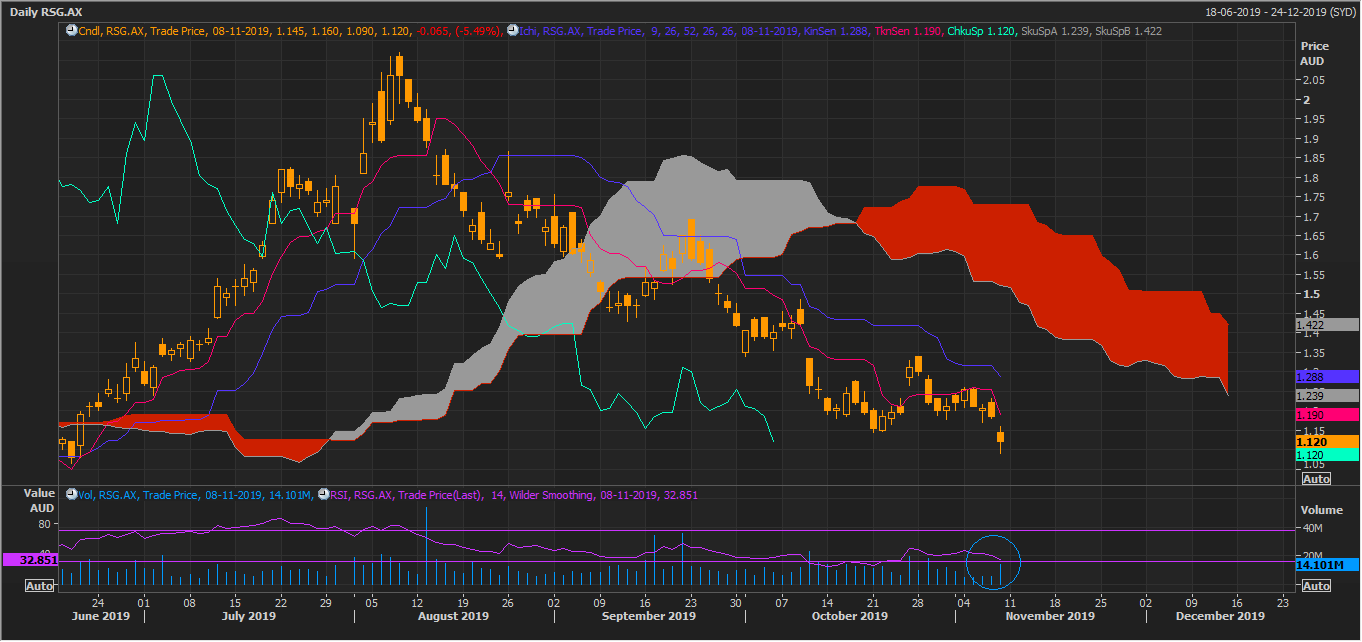
RSG Daily Chart (Source: Thomson Reuters)
On the daily chart, RSG is below the Span A with a prominent negative cross between the conversion line (pink line) and the base line (navy blue). The spread between Span A and Span B is further widening with falling RSI and spiking volume, which ,in turn, suggests that the share is currently being sold by the investors.
The downside Fibonacci projections for RSG on the daily chart from the coordinates marked as 0,1 and 2 are as below:
RSG Daily Chart (Source: Thomson Reuters)
Northern Star Resources Limited (ASX: NST)

NST Daily Chart (Source: Thomson Reuters)
NST is also following the same trajectory as RSG, and the stock is trading below the 50- and 200-days EMAs. The stock witnessed a large fall today on ASX with heavy volumes. If the prices fall further to close low, it could establish a negative crossover between 50- and 200-days EMAs.

NST Daily Chart (Source: Thomson Reuters)
On the daily chart, the stock is trading below the Span A, and with a strong negative crossover between the conversion line, which is mean of 9-day high and lows (pink line) and the base line or the mean value of 26-day high and lows (dark blueline).
The conversion line is crossing the base line from above and below Span A, which is a strong negative signal. In the status quo, the spread between the Span A and Span B is increasing, which further suggests that the downtrend remains strong.
The downside Fibonacci projections for NST on the daily chart from the coordinates marked as 0,1 and 2 are as below:

NST Daily Chart (Source: Thomson Reuters)
To conclude, the gold prices are retracing back in the international market and is currently at the crucial support level. The ASX-listed gold stocks are already under pressure amid the fall in gold prices, and are showing negative signs; however, a recovery in gold prices could boost the miners over the long-run, as market cheers out for gold for the years ahead.
Disclaimer
This website is a service of Kalkine Media Pty. Ltd. A.C.N. 629 651 672. The website has been prepared for informational purposes only and is not intended to be used as a complete source of information on any particular company. Kalkine Media does not in any way endorse or recommend individuals, products or services that may be discussed on this site. Our publications are NOT a solicitation or recommendation to buy, sell or hold. We are neither licensed nor qualified to provide investment advice.
