


In the contemporary eraâs evolving business world, with market containing a hoard of companies, it becomes difficult to keep a track on all of them. However, there are a few robust players, who have made concrete position for themselves across the globe and are considered the market's five most popular and best-performing tech stocks. It can be safely stated that imagining the present lifestyle of people, irrespective of country and race, would be incomplete without these companies.
The FAANG Group

Source: Companiesâ website
The above image needs no introduction. Over a majority of readers would know the constituents of the FAANG Group by merely screening these famous logos. FAANG stocks are growth stocks of five of the most dominant, popular and best-performing tech companies of the world- Facebook, Apple, Amazon, Netflix and Google, which trade publicly in the share market. Coined in 2013 by American TV personality Mr Jim Cramer, the group did not include Apple, initially. In March 2019, the market capitalisation of the group was valued at approximately $3.1 trillion.
The Experts take on FAANG
The FAANG stocks have always been renowned for their massive progress trajectories and soaring earnings multiples and comprise of nearly 20% of the S&P 500 index. Of late, the FAANG stocks have been in discussion as a subject of debates amid market experts. The rising competition for Netflix and Amazon has been heating up, resulting in the stock valuations to be shunned, as rising competition is not a necessarily a good thing, and it puts pressure on expectations. Giant retailers like Walmart have been adding on to the threat graph of Amazon, even though its market-leading cloud business is expected to keep it at the top position.
The hardware business of Apple is not just limited to growing it further, since it has been a slower growing segment. The company is focussed on the restoration of its user base, thriving to maintain some edge with the iPhones.
Facebook, a major component of FAANG, has been under the radar regarding its data and privacy concerns which cropped up worries last year. However, the stock of the company has maintained its calibre in 2019, after an anticipation towards adding channels for advertising on all its platforms.
Google, the world pioneer of search on the internet, is the one-man army when it comes to search engines, but experts believe that it needs to find a new growth driver.
Macro and Microeconomic factors Surrounding FAANG stocks
Amid the dominance of the tech stocks in the market, experts believe that investors have been pricing in the decelerating growth, rising costs and the potential for greater government oversight into these five stocks. In the past year, Facebook was the only stock in the group to have maintained an upward trend in the S&P 500 index, with others having their share of ups and downs. A major factor impacting the performance of these tech giants has been the increased global and U.S. recession worries, the on-going trade war between the worldâs two largest economies, China and the US; and the falling bond yields.
Let us browse through the FAANG stocks, individually, and understand their current positioning and trends:
Facebookâs Q219 Results
The Facebook Family of Services include Facebook, Instagram, WhatsApp and Messenger. While announcing last yearâs financial results and stating that the company was investing more to build new and inspiring ways for people to connect, Founder and CEO, Mark Zuckerberg stated that Facebook continues to grow as a community and business.
On 24 July 2019, the company released its financial results for the quarter ended 30 June 2019. It was reported that its daily active users were 1.59 billion on an average for June 2019, up by 8% on a Y-O-Y basis. The companyâs mobile advertising revenue represented approximately 94% of the entire revenue from advertising for the period, up by 91% on pcp. The company incurred capital expenditures of $3.78 billion and the cash and cash equivalents along with the marketable securities amounted to $48.60 billion. When it comes to people, Facebook had a headcount of approximately 39,650 as of 30 June 2019, up by 31% on a Y-O-Y basis.
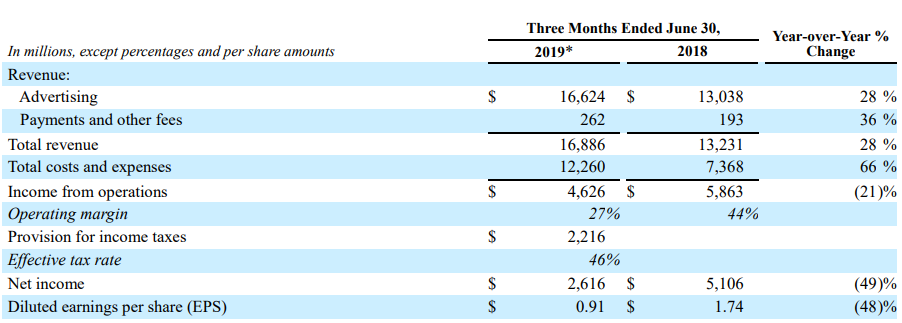
Second Quarter 2019 Financial Highlights (Source: Facebook)
The company believes that over 2.1 billion people used its family of services, and over 2.7 billion people used at least one of these each month. The company would pay a penalty of $5.0 billion to the FTC, after it entered into a settlement and modified consent order to resolve the inquiry of the FTC regarding the platform and user data practices.
Appleâs Q319 Results
On July 30 this year, Apple announced its financial results for the fiscal 2019 third quarter ended 29 June 2019, stating that it was the companyâs biggest June quarter ever, catalysed by the record revenue from services, strong performance from iPad and Mac, good progress through Wearables and enhancement in iPhone trends, across all geographic segments. The company posted total net sales of $53,809 million in the three months ended 29 June 2019 and its net income stood at $10,044 million. Further, for Q4 period, the company is expecting a revenue between $61 billion and $64 billion.
Amazonâs Q219 Results
Stating that the company was on a growth trajectory, Amazonâs Founder and CEO, Jeff Bezos stated that customers were responding to Primeâs move to one-day delivery and positive feedback was accelerating the companyâs sales growth. In its Second Quarter of 2019, the companyâs sales were up by 20% to $63.4 billion, and its operating income increased to $3.1 billion and Net income increased to $2.6 billion. For Q3, the company is expecting the net sales to range between $66 and $70 billion and the operating income is likely to range between $2.1 and $3.1 billion.
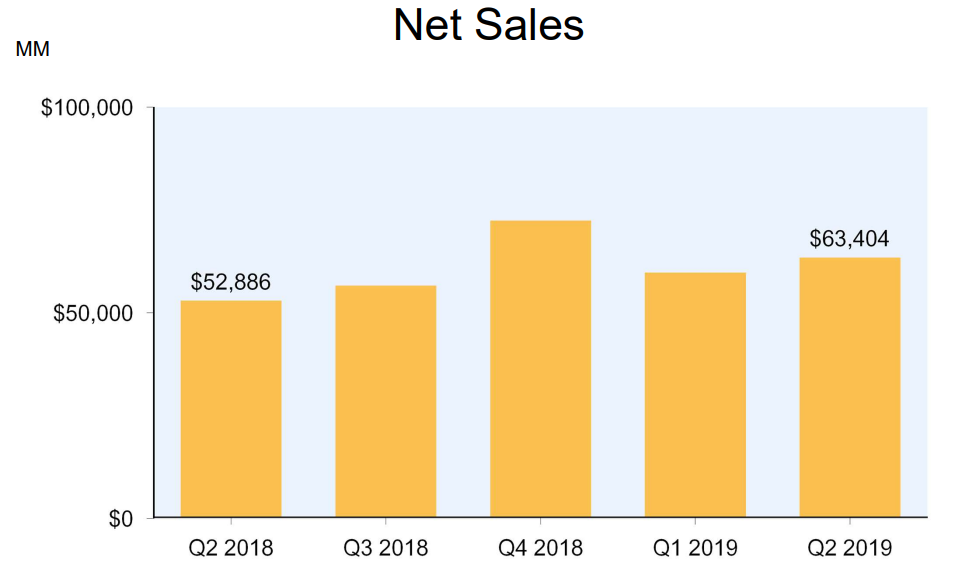
(Source: Amazon)
Netflixâs Q219 Results
On 17 July 2019, Netflix declared three-month report ending 30 June 2019. Netflixâs revenue growth augmented 400 basis points to 26%, and the operating income was up by 53% on a Y-O-Y basis in Q219 period. The paid membership grew by 2.7 million, less than the forecast of 5.5 million. The company anticipates a growth by 7 million paid memberships in Q319, as the rate of consumers moving from linear television to internet entertainment has depicted an upward trend. The companyâs average streaming paid memberships increased by 24% on a Y-O-Y basis and operating margin was of 14.3%, and the content slate of the period featured several highly watched titles. The company has been ramping up its marketing, which has evolved with the focus on launching key titles to build excitement amongst existing and non-members.
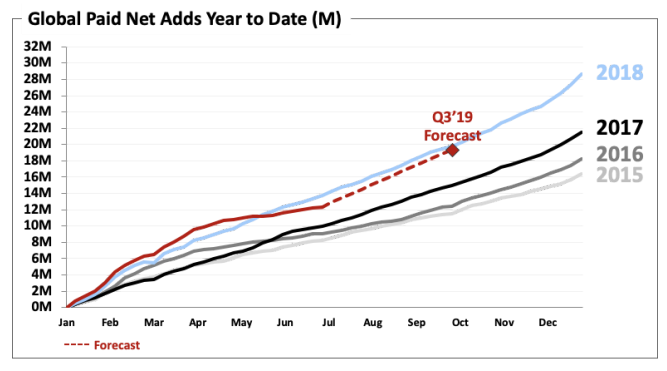
(Source: Netflix)
Googleâs Q219 Results
In the second quarter of 2019, Google's revenue amounted to $38.78 billion, with the main revenue source being the advertising via the Google sites and its network, like Google Search and Google Maps. In the period, its parent, Alphabet, reported sales of $38.94 billion. The company has been investing in projects that don't make money through advertising to up its game and sales of the company's Pixel line of smartphones had undertaken a growth trajectory as well, driven by the release of Pixel 3A in May 2019. Googleâs cloud division has been generating $8 billion of revenue per annum.
Stock Performance of FAANG
Let us browse through the performance of the FAANG stocks on NASDAQ, after the close of business hours on 4 September 2019:
| Company Name | Stock Conduct ($ and %) | Market Cap in $ (bn) |
| Facebook, Inc. (NASDAQ:FB) | 187.14, up by 2.60 | 533.90 |
| Apple Inc. (NASDAQ:AAPL) | 209.19, up by 1.70 | 945.37 |
| Amazon.com, Inc. (NASDAQ:AMZN) | 1,800.62, up by 0.60 | 890.69 |
| Netflix Inc (NASDAQ:NFLX) | 291.52, up by 0.77 | 127.64 |
| Alphabet Inc Class A (NASDAQ:GOOGL) | 1,182.27, up by 1.09 | 819.38 |
Disclaimer
This website is a service of Kalkine Media Pty. Ltd. A.C.N. 629 651 672. The website has been prepared for informational purposes only and is not intended to be used as a complete source of information on any particular company. Kalkine Media does not in any way endorse or recommend individuals, products or services that may be discussed on this site. Our publications are NOT a solicitation or recommendation to buy, sell or hold. We are neither licensed nor qualified to provide investment advice.
