


The Oil & Gas industry accounts for more than 40% of the total global emissions. The oil & gas industry right from taking the oil out from the well, refining it and then bringing it to customers globally, is an important part of the current energy market value chain. But the entire value chain, right from the upstream activities involve emissions of GHG gases to the supply chain to the refining process and ends at the customer point. The emissions are basically from the activities during the Crude oil/end products value chain on the consumption of energy or through the leakage of CO2 and Methane to the atmosphere.
The emissions have been scoped into various categories to avoid double counting and see the Oil & Gas industry in its whole extent –
- Scope 1 Emissions – Emissions related to the Oil & Gas itself and includes the leakage during upstream or midstream operations, emissions from engines at the drilling sites or from the oil tankers that transport the oil or gas.
- Scope 2 Emissions – The emissions related to the power which is purchased to fulfil the power requirements of the Oil production and auxiliary activities. Example: If the power is drawn from a thermal power plant will include the emissions in the generation of power at the thermal power plant.
The sum of scope 1 and scope 2 emissions gives an indication of the emission in getting the oil or gas unit out of the well and to the ground facilities. The sum of scope 1 & 2 emissions is also known as the "well to tank" or "well to meter" emissions.
The different crude oil sourced have different emissions, and so does the different end-use products from the same crude oil. For example – The marine fuel has a sulphur capping of 0.5% sulphur while for the road transport fuel the capping in most of the economies is restricted to 0.001% sulphur.
As per the IEA data, 95 kilograms of CO2 equivalent (kg CO2-eq) is estimated to be emitted in bringing the average barrel of oil to its end-use customers. The range of CO2 equivalent emissions for the crude oil varies from 45 to more than 200 kg CO2-eq after removing the 10 per cent outliers on each side.
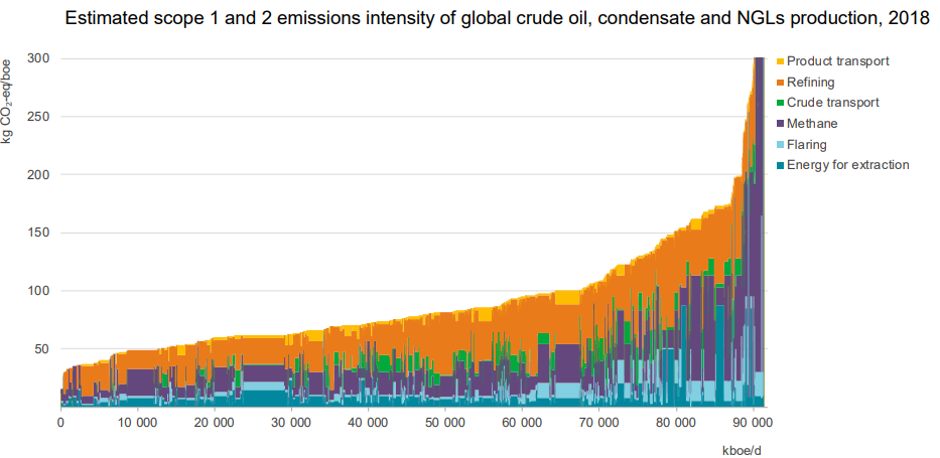
Source: IEA
As for the Natural gas, as per the IEA, the global average for the sum of scope 1 & 2 emissions stand at almost 100 kg CO2-eq per boe and varies much more than in the case of oil.
LNG-Hero or Hubris for Australian Energy Sector: Read Here
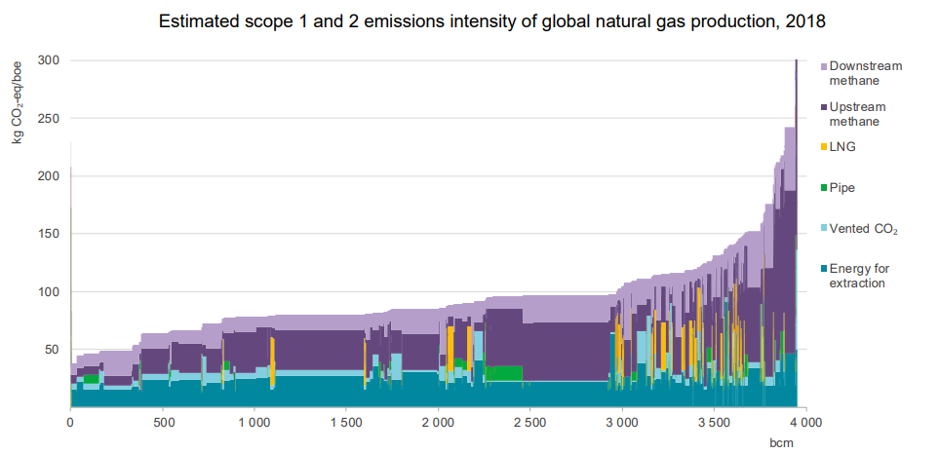
Source: IEA
- Scope 3 Emissions – The scope 3 emissions occur on the consumption of the fuel by the end-user.
The global average emissions from oil products produced from a barrel of crude oil equivalent in 2018 results in around 405 kg CO2 when combusted. The CO2 emissions from the combustion of natural gas, are on average 320 kg CO2/boe.
Australian Government Programs To Attain A Net-Zero Carbon Emission: Must Read
The pressure on the industrial sector is ever increasing to move to greener and cleaner fuel sources-
- Paris Climate Agreement - The Paris agreement aims to restrict the global temperature rise for this century well below 2 degrees Celsius above pre-industrial levels and to limit the temperature increase even further to 1.50
 Source: CleanEnergyBC
- Capital Markets – The institutional investors and the insurance companies have started limiting their exposure to mainly coal projects but to some extent, still study the oil & gas projects. An increasing trend of investment based on the environmental effect of the projects has been observed. The disruption in finance for fossil fuel projects have increased the required rate of return on equity.
Also, with more environmentally cautious shareholders, the companies have to publish regular sustainability and have become a social obligation to cut down on the emissions. The companies are now required to improve their disclosures and adhere to a sustainable way of doing business to continue in the market. The growing global scrutiny on the rising emissions of the industry has resulted in the changes. The investors have accepted cleaner and greener stocks to be better due to the efforts of the company in making it greener.
The efforts of the companies are appraised by investors and have begun to act as an indicator of being dynamic and technologically savvy.
- Opposition to new infrastructure projects – Local environmental issues have led to increasing protest to the oil & gas infrastructure projects. The protests often escalate to lengthy and difficult permitting procedures and litigation leading to project delays and cost overruns. In other cases, projects have been indefinitely postponed or cancelled.
- Fracking bans – The surge of shale oil led the industry to be more dependent on hydraulic fracking which has been linked to several environmental implications such as increased seismic activity and impact on water supplies. Fracking has been banned in regions with seismic risks such as New York, Quebec and many parts of Europe.
Decarbonisation Techniques for Upstream, midstream and Downstream
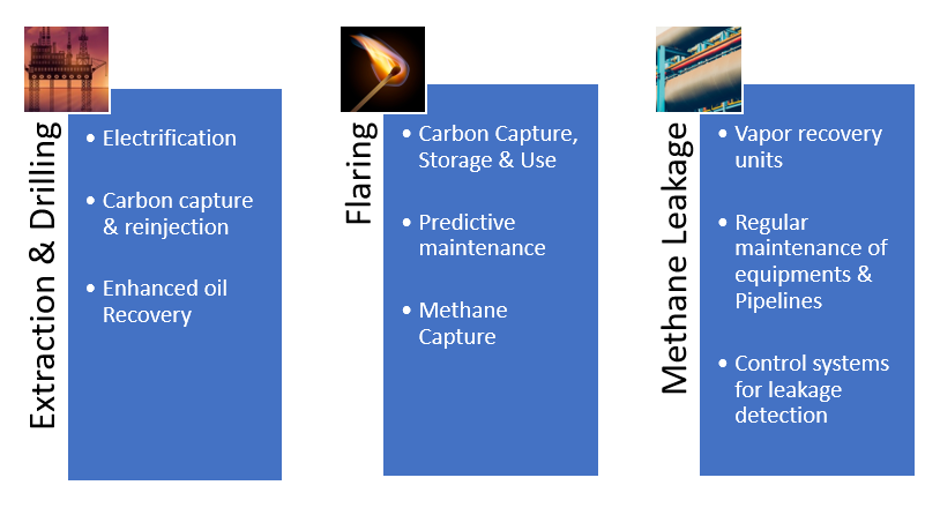
The decarbonization in the upstream sector in majorly these activities –
Upstream Sector – Oil Extraction
The well site is being electrified using power from the grid or from photovoltaics instead of the diesel generators. The usage of photovoltaics and wind power has become frequent and is used by most of the top 10 producers.
Carbon capture, use and storage is an upcoming practice by the major oil producers for centralised and controlled emissions and for the enhanced oil recoveries. The CCUS steps involve capturing of carbon, transportation of the carbon dioxide via pipelines or other mediums and permanent storage of the GHG gas underground or reuse for use in creating product and services.
The EOR techniques ensure maximum recovery of oil resources from a field and apply injection of heat, gas or chemicals for higher recovery. Also, known as Tertiary or Quaternary Recovery. CCUS techniques are commonly integrated by reinjection of the carbon dioxide to get the extra oil out.
The predictive maintenance technologies can estimate the maintenance required even before the damage occurs, therefore reducing the shutdown time and in turn, increasing efficiency apart from reducing the carbon emissions.
On the oil rigs, Methane leakage is often experienced as Methane sits on the top portion of the caprock and once the drill bit cracks into, there is leakage of methane, this methane can capture, rather than being flared off.
Midstream – Crude Transport
The carbon emissions from this sector are easiest to control but have been rarely practised in the past. Usage of pipelines has proved to be an environmentally friendly and greenest way to transport oil & gas. Example: Druzhba pipeline which runs from Germany to Russia is the longest operating oil pipeline at the moment.
Downstream Sector
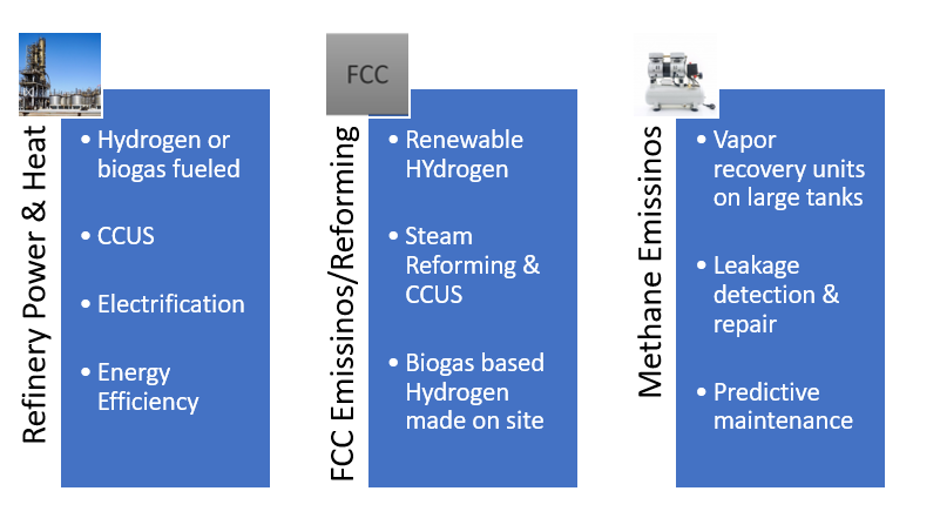
Refinement
Hydrogen from the steam reformer or from external sources could be used to feed the heating and power systems of the refinery. Biogas, formed from the by-products of vegetable oil, also proves to be suitable, but not the most practical technology as of now but has the possibility to be one in future.
The usage of electric furnace coupled with electricity from green sources will lead to a substantial reduction in GHG emissions. Example: Shell, the mega refiner, is evaluating the idea of switching to solar for Bukom refinery heat & energy demands.
The upgradation of heat furnaces and boilers to more energy-efficient and modern versions will help reduce the refineries count on the emissions.
Fluid catalytic cracking, the unit responsible for maximisation of propylene, is the most dominant cracking technology, the hydrogen from the steam reforming could be recycled and used as a fuel to feed the FCCUs.
Origin Energy Joins the Cause of Reducing Carbon Footprints: Click Here
In order to control leakages in refineries and downstream plants, leakage and pressure control systems are used along with the upcoming practice of predictive maintenance of the compressors and pipelines. Vapour recovery or condensing units have been installed in the modern refineries to present the escape of vapours on large tanks.
Source: IEA
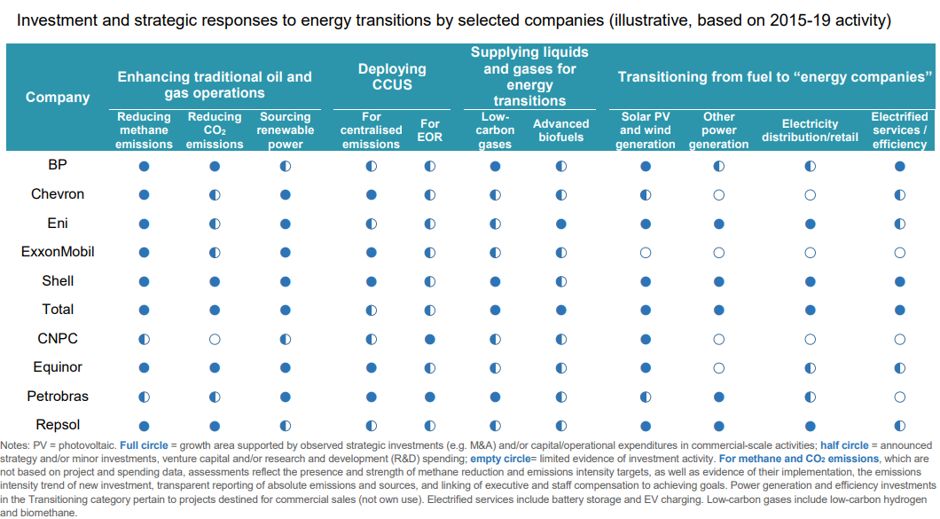
The quantum of the efforts can be measured by the change in the Oil & Gas industry in the last 5 years (2014-2019) and the steps taken by the major players which decide the game to be followed by the rest of the industry. The rules of the games have already changed, and with the possibility of carbon tax implementation on industrial sectors in even more economies, the ease to operate through conventional and old techniques would not be welcoming the hesitant players.
