


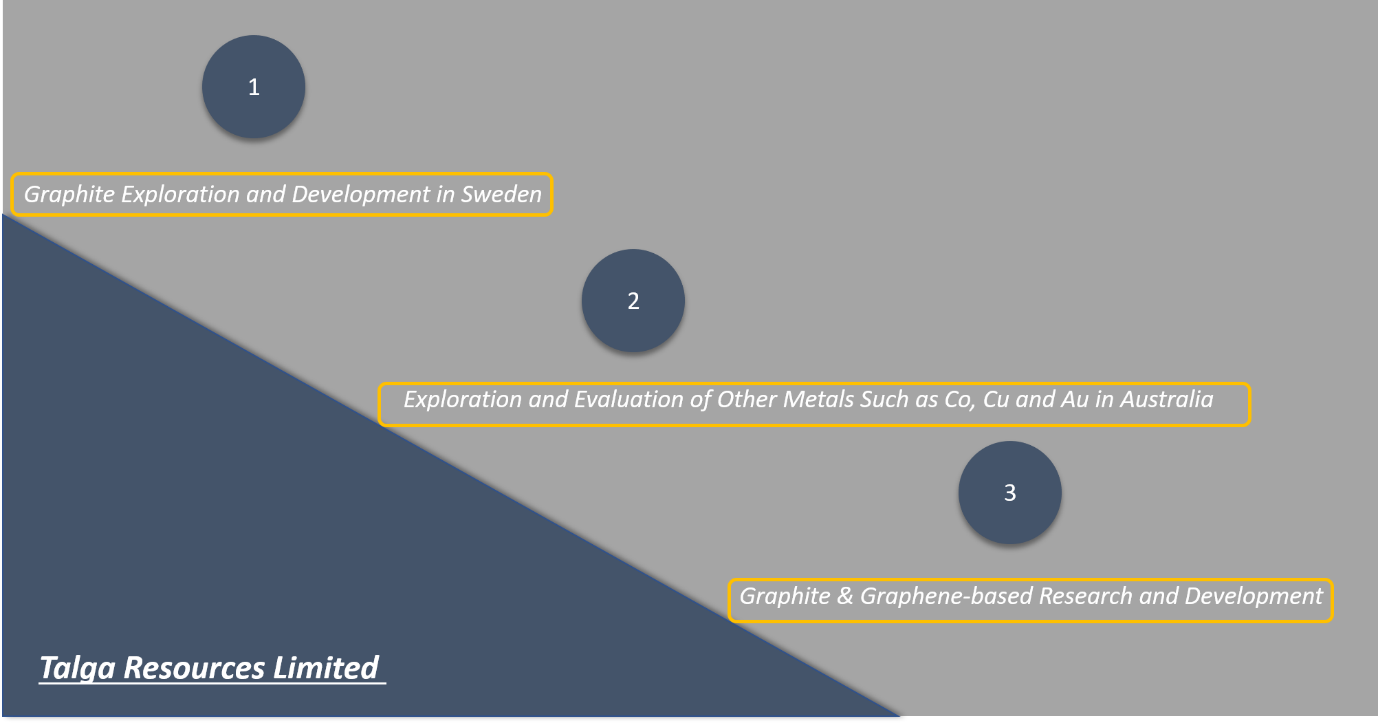
Talga Resources Limited (ASX: TLG) is an ASX-listed graphite miner, which is engaged in the exploration and development of graphite projects though trail mining. The company is also involved in the graphite and graphene-based research & development through its pilot plant test facility in Germany. The business model of the company branches into three fields.
The operations portfolio of the company includes Vittangi, Raitajarvi, Pitea, Jalkunen and Pajala graphite projects. The company has exposure in iron ore as well through its Masugnsbyn and Vittangi project in Norrbotten County in northern Sweden.
TLG holds about four gold projects in the golden hub of Australia- Western Australia, and the gold project of the company includes Talga Talga, Warrawoona and Mosquito Creek in East Pilbara gold region.
The company intends to build a vertically integrated business through its wholly-owned graphite prospects, processing innovations and patented technologies.
Pre-Feasibility Suggests Strong Project Economics
During the June 2019 quarter, the company completed a Pre-feasibility Study (or PFS) over its Vittangi Graphite project, which is a tier-1 high-grade prospect and is wholly-owned by the company in north Sweden. As per the company, the PFS confirmed the planned two-step pathway, which includes two-stage mining along with downstream processing, is financially robust with strong economic returns.
PFS Highlights:
The PFS suggested a pre-tax project Net Present Value (NPV)8 of US$1,056 million with a pre-tax Internal Rate of Return (IRR) of 55 per cent. The PFS further suggested the total revenue of US$4,148 million over the 22 years life of mine with a net profit before tax of US$3,133 million.
The PFS also suggested a staged development with initial Stage 1 capex of US$27 million and Stage 2 estimated capex of US$147 million, and a steady-state 19K tonnes per annum production of fully coated Talnode®-C via integrated concentrator and anode refinery.
Benchmark Mineral Intelligence independently assessed the price of the companyâs proprietary Talnode-C price in the range of US$11,250 per tonne, with an anticipated production cost of US$1,852 per tonne.
TLG plans for the Stage 1 commencement in mid-2020, and the company mentioned that the PFS outcomes are based solely on Vittangiâ s maiden Nunasvaara South deposit Ore Reserve.
Li-ion battery anode material:
During the June 2019 quarter, the testing of Vittangi graphite ore produced high concentrate recoveries along with purities, which as per the company, remains suitable for industry-standard Li-ion battery anode material products.
Apart from Vittangi, the other graphite operations of the company including Jalkunen and Raitajarvi employed the same industry standards and produced similar results, which in turn, supports the company over the development of Li-ion battery anode material.
Graphite Anode Project:
The PFS over the Vittangi project of the company proposed strong economic returns along with a conventional open-pit mining operation with an on-site concentrator and coastal anode refinery in order to produce the proprietary Talnode®-C.
The project economics through the PFS are depicted below:
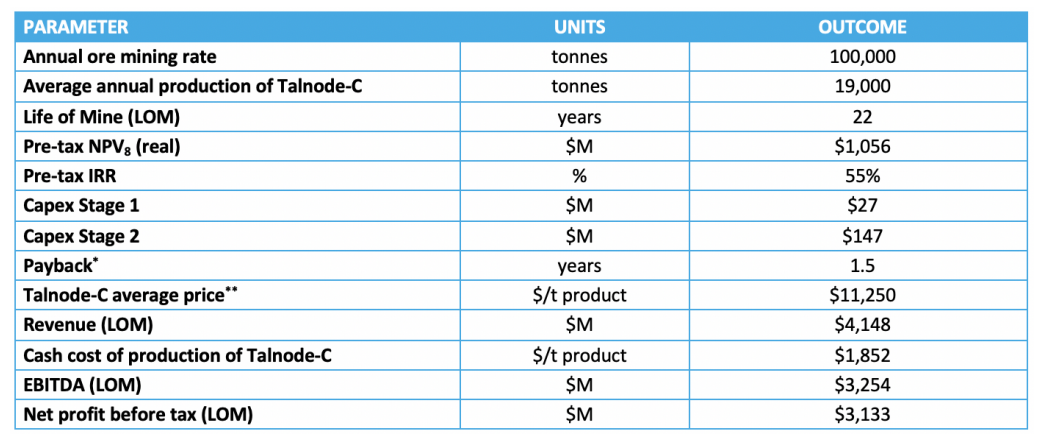 (Source: Companyâs Report)
Expansion in Vittangi Graphite Resources:
The company conducted a diamond drilling program at the Niska graphite deposit, which is along the Nunasvaara Mineral Resource of 12.3 million tonnes with an average grade of 25.5 per cent graphite within the Vittangi project.
TLG received the assay results from the diamond drilling program completed by the company, and some of the significant findings are as follow:
The drill hole identified as NUN19010 resulted in 135.6m @ 25.8 per cent graphite from 4.4m, including 21.6m @ 25.9 per cent graphite from 4.4m and 88.1m @ 29.8 per cent graphite from 51.9m.
The drill hole identified as NUN19003 resulted in 30.2m @ 25.2 per cent graphite from 15.3m.
The drill hole identified as NUN19004 resulted in 33.3m @ 26.3 per cent graphite from 25.0m.
The drill hole identified as NUN19006 resulted in 18.8m @ 27.2 per cent graphite from 37.7m.
Price Actions:
The share prices of the company are moving down from its 30 April 2019 high of A$0.730, and currently reached the low of A$0.365 (Dayâs low on 6 August 2019), which in turns marks a fall of 50 per cent in less than three months.
TLG on Charts:
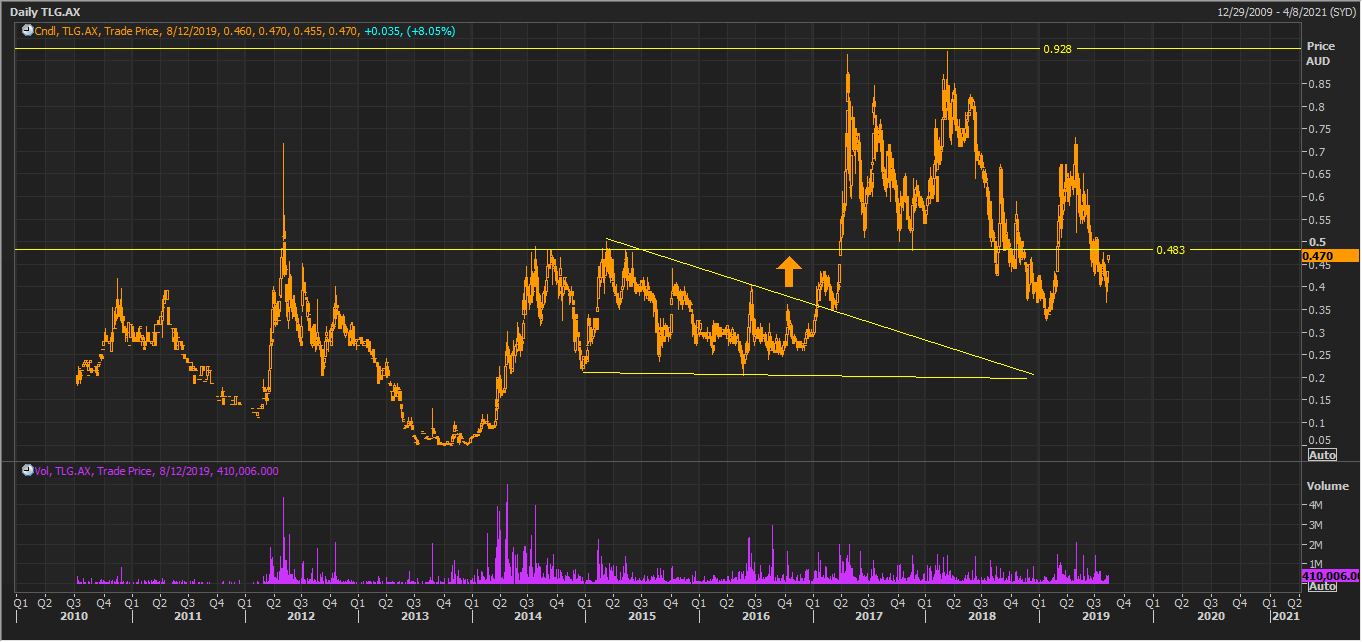 TLG Daily Chart (Source: Thomson Reuters)
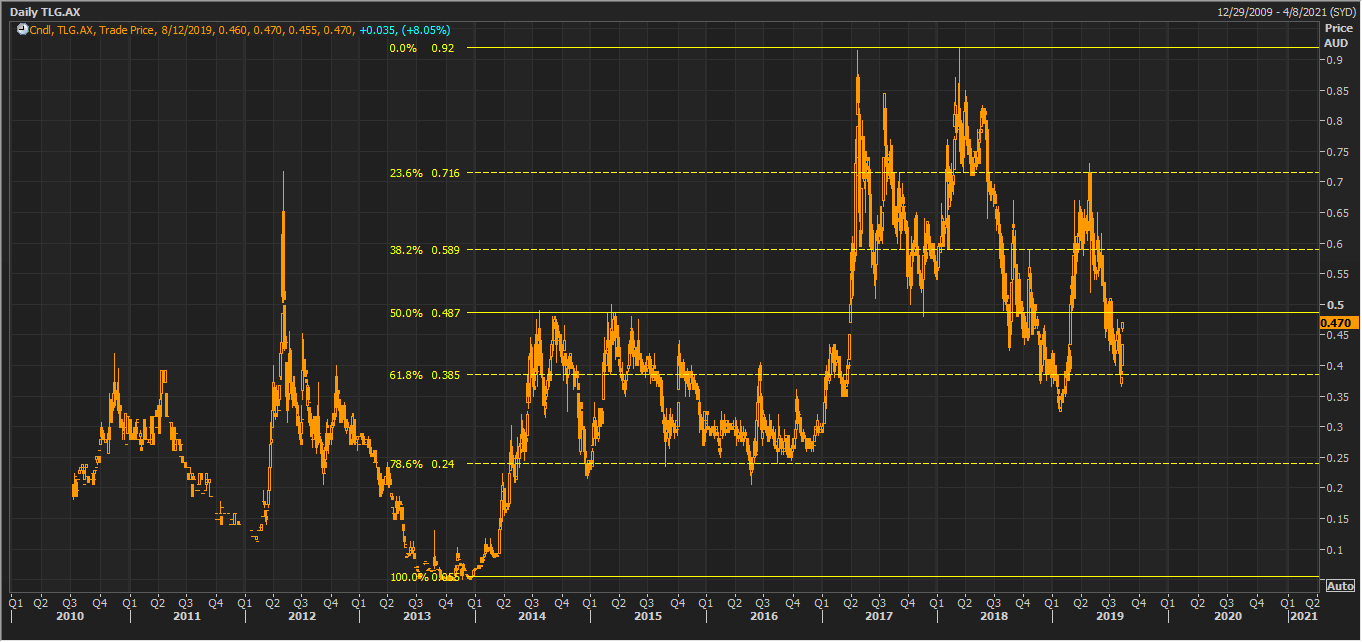
On a daily chart, the share prices of the company breached the potential symmetrical triangle formation and reached the level of approx. A$0.928, from where the share prices of the company retraced back to test its support level of A$0.483.
Post touching the support, the share prices of the company again rose to the same level of A$0.928 and the level of A$0.928 acted as resistance again, and the share of the company dropped again to correct.
 TLG Daily Chart (Source: Thomson Reuters)
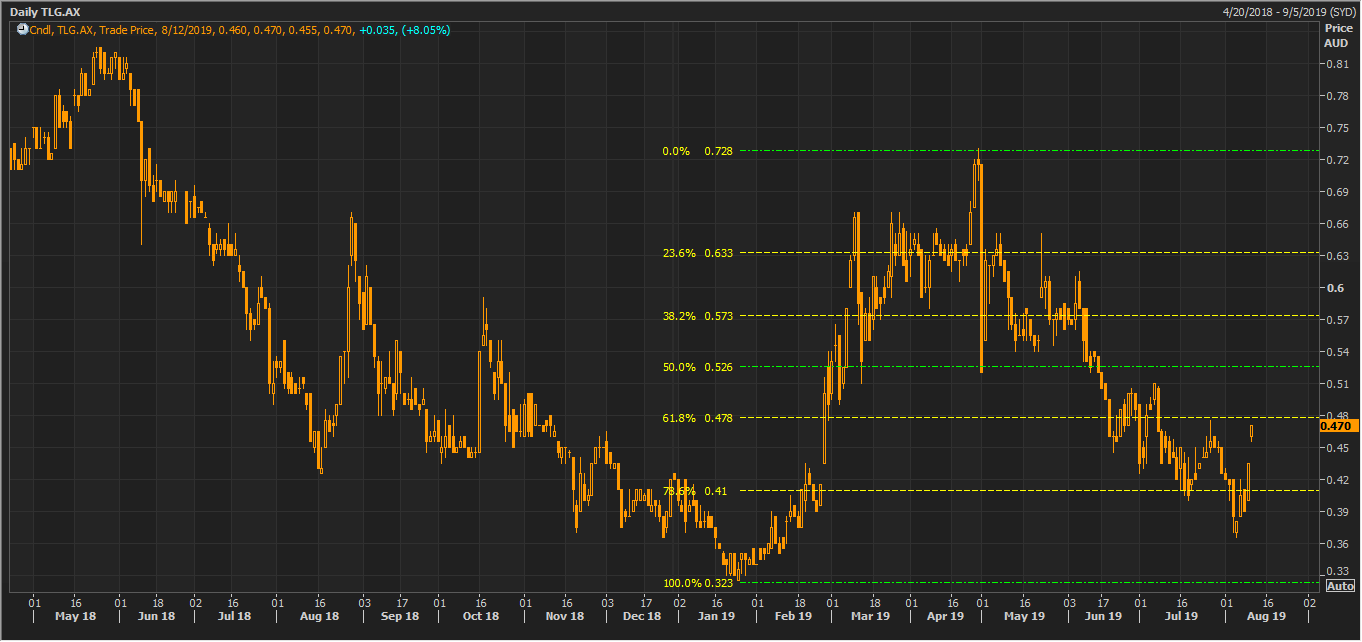
On taking into account the beginning point of the rally to the endpoint of the rally, we can see that the share prices of the company have now corrected over 61.8 per cent, which is the same level from where the shares of the company previously demonstrated the buyerâs interest.
 TLG Daily Chart (Source: Thomson Reuters)
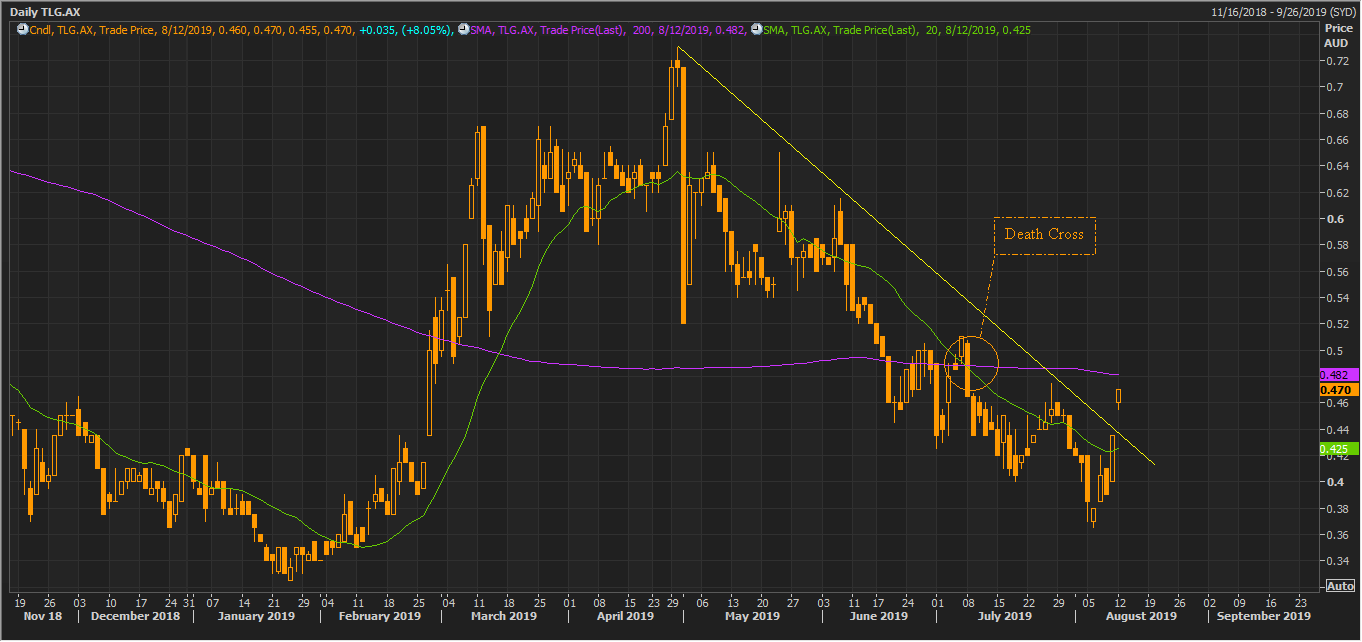
One particularly intriguing observation on the daily chart is the breakout of the downward sloping trendline, with a gap up opening observed on 12 August 2019. Now, the investors should keep an eye over the downward sloping trendline as a break below and sustain, or failure to do so would decide if the share prices would again show the buyerâs interest from the retracement level of 61.8 per cent.
However, the 200 and 20 days simple moving average is showing a Death Cross (bearish signal), which in turn, suggests that the downtrend remains intact. Investors should monitor the levels mentioned above carefully as a break above or below these levels could decide the further price actions in it.
 TLG Daily Chart (Source: Thomson Reuters)
On following the last rally in the share prices of the company, which started at the beginning of the year 2019 or from the level of approx. A$0.323 and halted at the level of approx. A$0.728, we can observe that the share prices of the company have now corrected over 78.6 per cent of the last rally, which in turn, suggests that the buyerâs interest could be developed; however, for that, the breakout of the downward sloping trendline should remain intact.
 TLG Daily Chart (Source: Thomson Reuters)
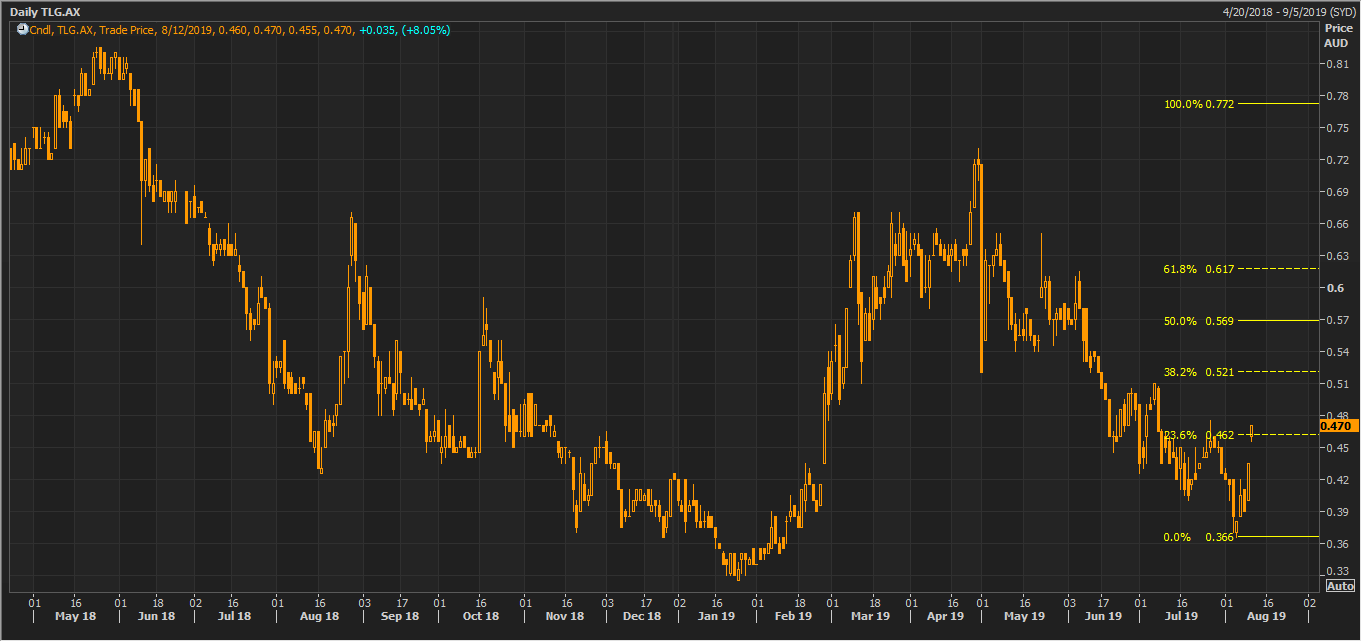
On projecting the Fibonacci Series from the same rally point to the halt point of the recent rally, we can observe that the share prices of the company have now breached 23.6 per cent projected level of A$0.462. As per the Fibonacci, the support for the share prices is at A$0.366, while the immediate hurdle remains at A$0.521.
Disclaimer
This website is a service of Kalkine Media Pty. Ltd. A.C.N. 629 651 672. The website has been prepared for informational purposes only and is not intended to be used as a complete source of information on any particular company. Kalkine Media does not in any way endorse or recommend individuals, products or services that may be discussed on this site. Our publications are NOT a solicitation or recommendation to buy, sell or hold. We are neither licensed nor qualified to provide investment advice.
