


The gold price rally was again supported by the strong buying from the central banks and gold-backed ETFs in August. The push-in gold price to a record high ignited euphoria in the ASX-listed gold miners and explorers. However, gold price witnessed a sell-off in the past few trading sessions post reaching a record high of US$1,533.98 (Dayâs high on 4 September 2019).
Also Read: Central Banks and Gold backed ETFs led Gold Shine; Whatâs next for the Safe-Haven?
Global Events Fanning Gold:
The prevailing lower interest rate in the global market is attracting investors toward gold, which in turn, is propelling the gold prices in the international market. Apart from the low-interest rate, the free fall in the global bond yields, which took the bond price to the record highs, is also supporting the gold price in the market.

Gold-Backed ETFs Demand Push:
The global gold-backed ETFs added 122.3 tonnes of gold into their holdings in August 2019 with approx. USS$6.0 billion of net inflows to take the global gold-backed ETFs holding to 2,732.6 tonnes. The total global gold-backed ETFs holdings of approx. 2,733 tonnes are just 59 tonnes or 2 Per cent less from the 2012 record level of 2,791 tonnes.
Global gold-backed ETFs added 13 per cent of total AUM over the past three months amid falling interest rates and inversion of US2y/10y Treasury Curve.
On the regional basis, North America again stood at the number one spot, and the gold-backed ETFs in the region added 77.9 tonnes or US$3,764.2 million of gold to take the total holdings to the level of 1,383.2 tonnes (as on 31 August 2019).
The higher inflows in the North America region was mainly contributed by the inflows from Worldâs largest gold-backed ETFs house- SPDR Gold Shares.
The United States-based SPDR Gold Shares
- Added 54.9 tonnes of gold, 7.0 per cent higher against the previous month addition.
- Total gold holdings of the ETF reached 878.0 tonnes.
- Accumulated 2.3 tonnes during August 2019,
- Joint holdings of the low-cost ETFs at all-time high of 58 tonnes (US$2.8 billion)
European-listed gold-backed ETFs
- Added 33.4 tonnes of gold in August, up by 2.8 per cent MOM.
- Total holdings of European ETFs reached 1,235.3 tonnes.
- European gold-backed ETFs in witnessed a high inflow as the pound depreciated over the high probability of a âNo-deal Brexitâ.
Gold-Backed ETFs YTD Flows:
As per the data from the World Gold Council, the global gold-backed ETFs added 292 tonnes of gold on a YTD (as on 31 August 2019) basis, which in turn, marks over 10 per cent of the total asset under management.
European funds grew consistently on the YTD basis this year and the UK-based fund holdings reached an all-time high of 577 tonnes or 21 per cent of the global gold-backed ETF assets in August.
Also Read: Gold-Backed ETFs Vs Gold; A look At Direct And Indirect Investment Approach
Gold on Charts:
XAUUSD Daily Chart (Source: Thomson Reuters)
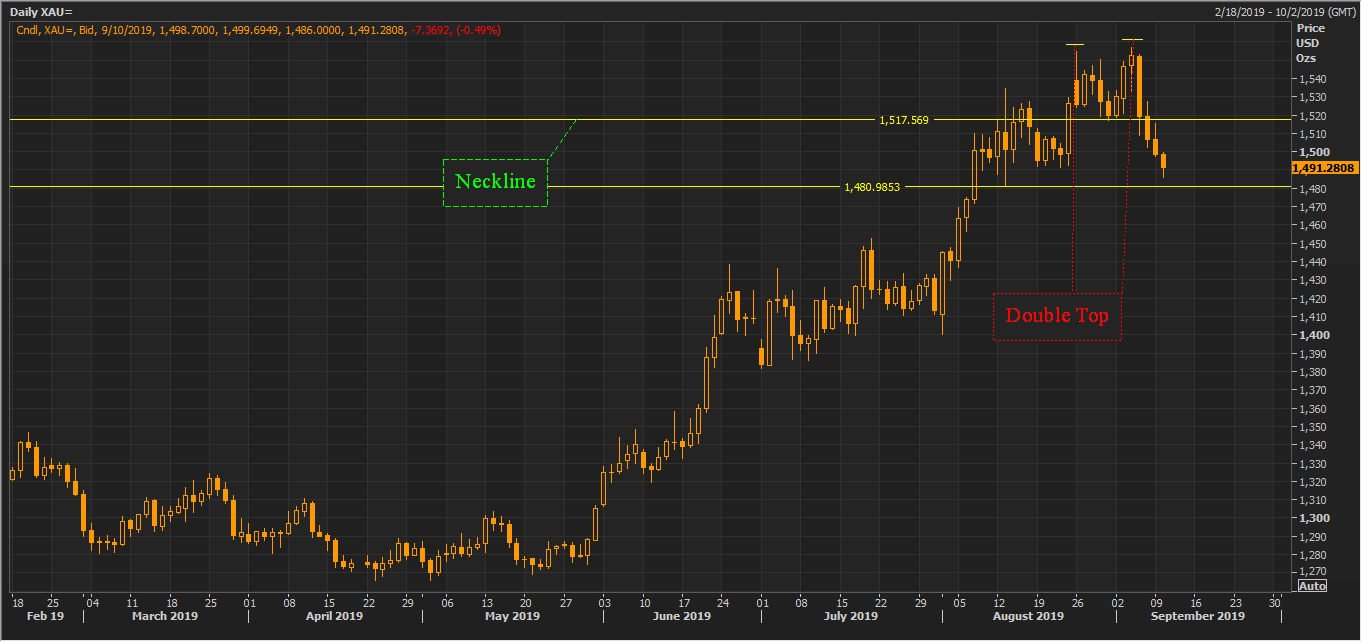
On the daily chart, the gold price is rallying to the level of approx. US$1,560, where the price is taking a strong hurdle. The gold price took a U-turn twice from the level of approx. US$1,557, which, in turn, established a minor double top pattern (bearish pattern). Gold price broke below the neck-line, established at US$1,517, and currently trading below the neck line.
Gold price is currently consolidating around the immediate support line established at US$1,480.

XAUUSD Daily Chart (Source: Thomson Reuters)
On analysing the daily chart further, we can observe that the gold price is presently taking the hurdle of both 9- and 21-days exponential moving averages, which are at US$1,522.23 and US$1,512.09, respectively.
Gold is presently trading below the 9- and 21-days EMAs, but above the 200-day EMA, which is at US$1,364.74, which could act as the major support for gold.
XAUUSD Daily Chart (Source: Thomson Reuters)
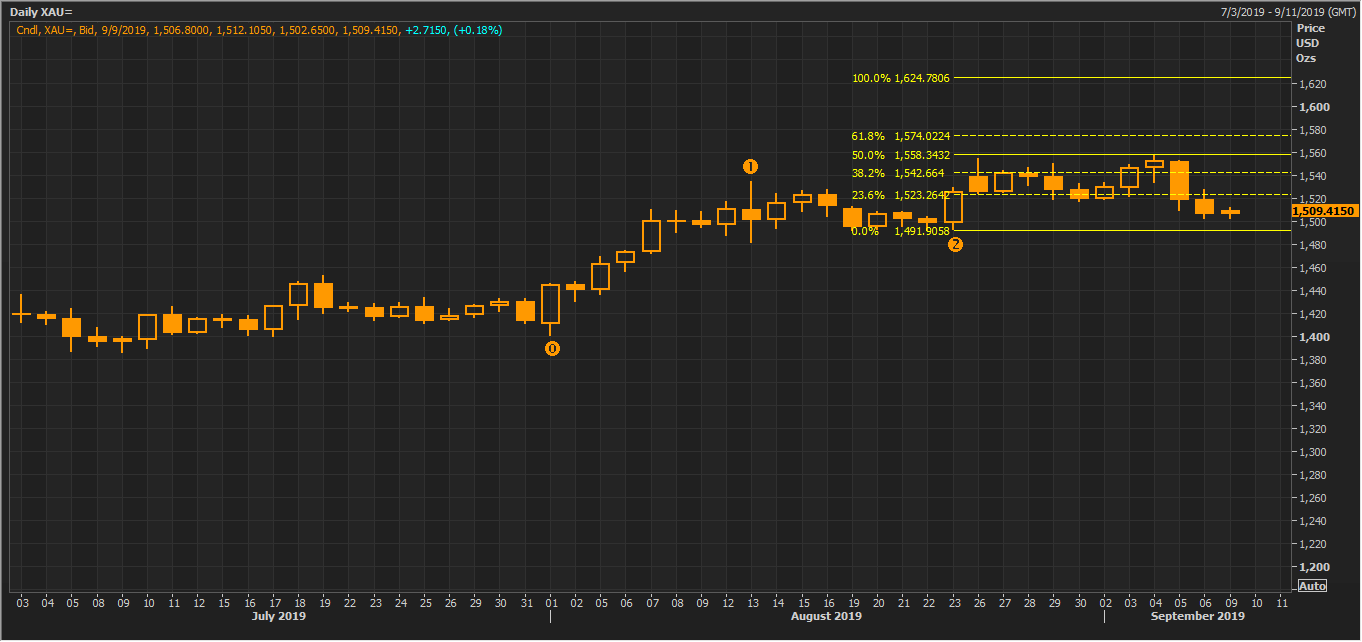
On projecting the Fibonacci from the points marked as 0,1, and 2, we can see that the gold price could take the support of US$1,491 and the hurdle. On observing the projections, we can see that the price is taking a hurdle at 50.0 per cent of the projected level, which is at US$1,558.3432. The projected level of the Fibonacci series would remain intact until the gold price breaches the low of the candle marked a (2) on the daily chart.
ASX-Listed Gold Miners:
ASX-listed gold miners and explorers have taken a jolt over the slight decline in gold prices, and the prices of ASX-listed gold stocks have cracked slightly from their recent tops. However, the original bull trend in the gold mining stocks on the Australian Securities Exchange remains intact amid the future forecast of a further rally in the gold prices.
Northern Star Resources Limited (ASX: NST), which traded at a new 52-week high of A$14.055 (on 24 July), last traded at A$10.550, down by over 24.9 per cent from its 52-week high and 4.78 from its previous close (as on 10 September closing price).
Likewise, Newcrest Mining Limited (ASX: NCM), which traded at a new 52-week high of 38.870 (on 8 August 2019), is presently trading at A$34.130, down by approx. 12.19 per cent from its recent 52-week high and by 4 per cent against its previous close on ASX (as on 10 September closing price).
Also Read: Gold Rush Led The ASX-listed Gold Miner Shine; A Glimpse Over 10 Gold Stocks
In a nutshell, the gold prices soared over the demand push and trading near its record high amidst buying from the global gold-backed ETFs, which continued steady buying from the starting of the year 2019.
However, the recent slight correction in the gold price, post unfolding of the double top pattern formation on the daily chart, exerted pressure on the ASX-Listed gold stocks and the gold stocks on the Australian exchange are under pressure in the past few trading sessions.
Disclaimer
This website is a service of Kalkine Media Pty. Ltd. A.C.N. 629 651 672. The website has been prepared for informational purposes only and is not intended to be used as a complete source of information on any particular company. Kalkine Media does not in any way endorse or recommend individuals, products or services that may be discussed on this site. Our publications are NOT a solicitation or recommendation to buy, sell or hold. We are neither licensed nor qualified to provide investment advice.
