


Gold prices have recently topped the charts amid an expected interest rate cut by the United States Federal Reserve. The market participants are hoping that the United States FED would reduce the interest rate twice or thrice before the year-end, which, in turn, is supporting the gold prices in the international market.
How did gold perform so far in 2019?
Post a head start from the level of US$1282.37 (opening in January 2019); the gold spot prices rose to the January high of US$1326.32 before ending the month at US$1321.13, up by over 3 per cent against its monthly opening.
After a rise of more than 3 per cent, the gold prices witnessed three consecutive monthly declines to the level of US$1266.43 (low in April 2019).
However, this time gold dipped just to shine back, and the prices reached the level of US$1438.99 (high in June 2019) from its April low of US$1266.43, which in turn, underpinned the growth of over 13.60 per cent.
The gold rush prompted the market participants to adopt a bullish stance over gold price momentum, which was evident from the high inflows in gold-backed ETFs, and net longs in the COMEX futures. As per the data, the gold-backed ETFs captured US$5.0 billion till 11th July 2019, which, in turn, accounts for 108 tonnes. The net longs on the COMEX Gold Futures (GC) averaged 369t during the first half of the year 2019.
The bullish stance over gold is just not adopted by the market participants; the central banks are also pulling up the gold reserves. Through May 2019, the central banks reported the net purchase of 247 tonnes of gold, which in turn, underpins a value of US$10 billion.
The Australian Department of Industry, Innovation and Science (DIIS)s has forecasted that the gold prices would likely to rally till US$1440.
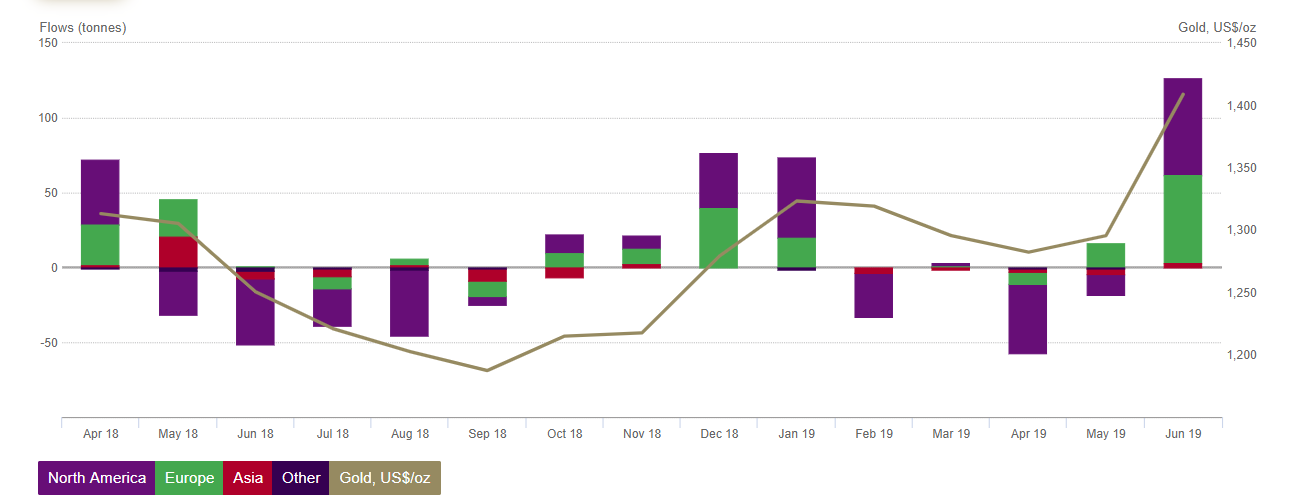
Global gold-backed ETF holdings and Flows:
The global gold-backed ETFs rose sharply in June 2019 by approx. 127 tonnes to stand at 2,548 tonnes or US$5.5 billion. On a regional basis, North America marked an inflow of 64.9 tonnes or US$2.858 billion in June 2019, while Europe accounted for an inflow of 59.1 tonnes or US$2.545 billion. The inflow from both the regions inched up by 5.0 per cent and 4.7 per cent respectively from the previous month of May 2019.
As on 30th June 2019, North America region marked a net inflow of 31.1 tonnes or US$1.522 billion from the starting of the year, while Europe marked a net inflow of 87.2 tonnes or US$3.907 billion from the starting of the year 2019.
 Source: World Gold Council
The United States largest gold fund- SPDR, inched up the gold buying by 50.8 tonnes or US$2.240 billion in June 2019, which was up by 7.2 per cent as compared to the previous month of May 2019.
The total holdings of SPDR stood at 793.8 tonnes or US$4.2 billion till 30th June 2019 from the beginning of the year, which was 1.3 per cent up as compared to the previous corresponding period.
Half-Year 2019 for Gold-backed ETFs:
The global gold-backed ETFs added 67 tonnes or US$3.1 billion in the second quarter of the year 2019, which is 11 per cent up on a yearly basis and about 2.7 of asset under management (AUM).
The global gold-backed ETFs surged by 4.3 per cent of the AUM in the 1H CY2019, and Europe contributed significantly (about 78 per cent) on a YTD basis (till 30th June 2019), which, in turn, was 7.3 per cent higher in 2019 as compared to the previous corresponding period.
Stock Market Vs Fixed Income Instruments Discrepancy:
The S&P 500 Index rose to an all-time high of US$3013.77 on 12th July 2019; yet, the bond prices are skyrocketing in the market, and the yield-to-maturity or the market discount rate on the bond is declining. As per the data, the negative-yielding debt is at all-time highs (approx. US$13 trillion).
The discrepancies between the stock and the fixed income market are majorly due to the market expectation of two or three consecutive decline in the interest rate by the United States Federal Reserves before the year-end.
Over such inconsistencies, gold prices are zooming as the central banks and funds are hedging over the similar uprise in both equity and bond markets.
In the coming half of the year, such inconsistencies could support the gold prices, and the United States Federal Reserve has a historical record of acting in tandem with the market expectation over the interest rate scenarios.
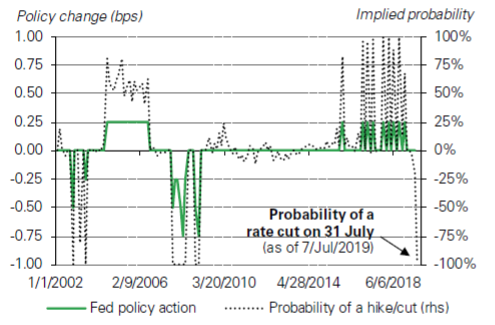
Historical FED actions and market expectations (Source: World Gold Council)
Over the inconsistencies between the equity and the fixed income market, and historically proven track record of FED interest rate movement in tandem with the market expectations, the gold prices are soaring in the international market.
Gold and the Central Banks:
The gold demand from central banks is inching quarter-on-quarter, as the central banks are preparing to stand ready to stimulate the domestic economic conditions if a more significant global slowdown occurs.
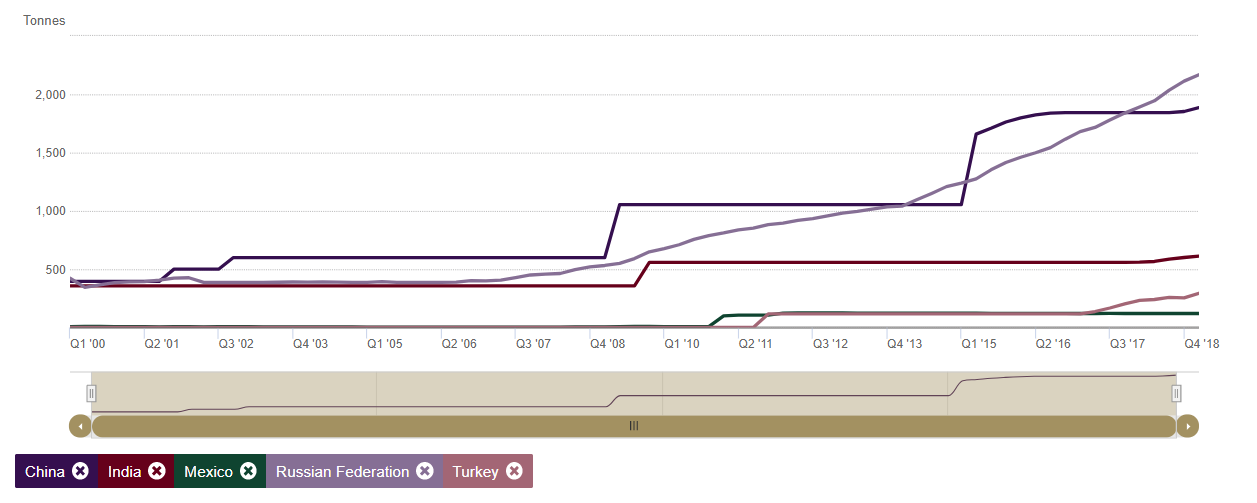 Quarter-on-Quarter central banks gold buying (Source: World Gold Council)
The risk factors, which is looming the central banks buying, is the potential negative long-term effect of the re-escalated U.S-China trade war. Apart from the fear of higher tariff in the global market, the surmounting tension between the United States and Iran is also pulling up the central banks buying.
Besides, the opaque clouds over the Brexit and various other political and economic concerns in the United Kingdom and Europe is prompting the central banks to get ready if the risk bubbles emerge in the global market, which in turn, is supporting the gold prices.
Gold on Charts:
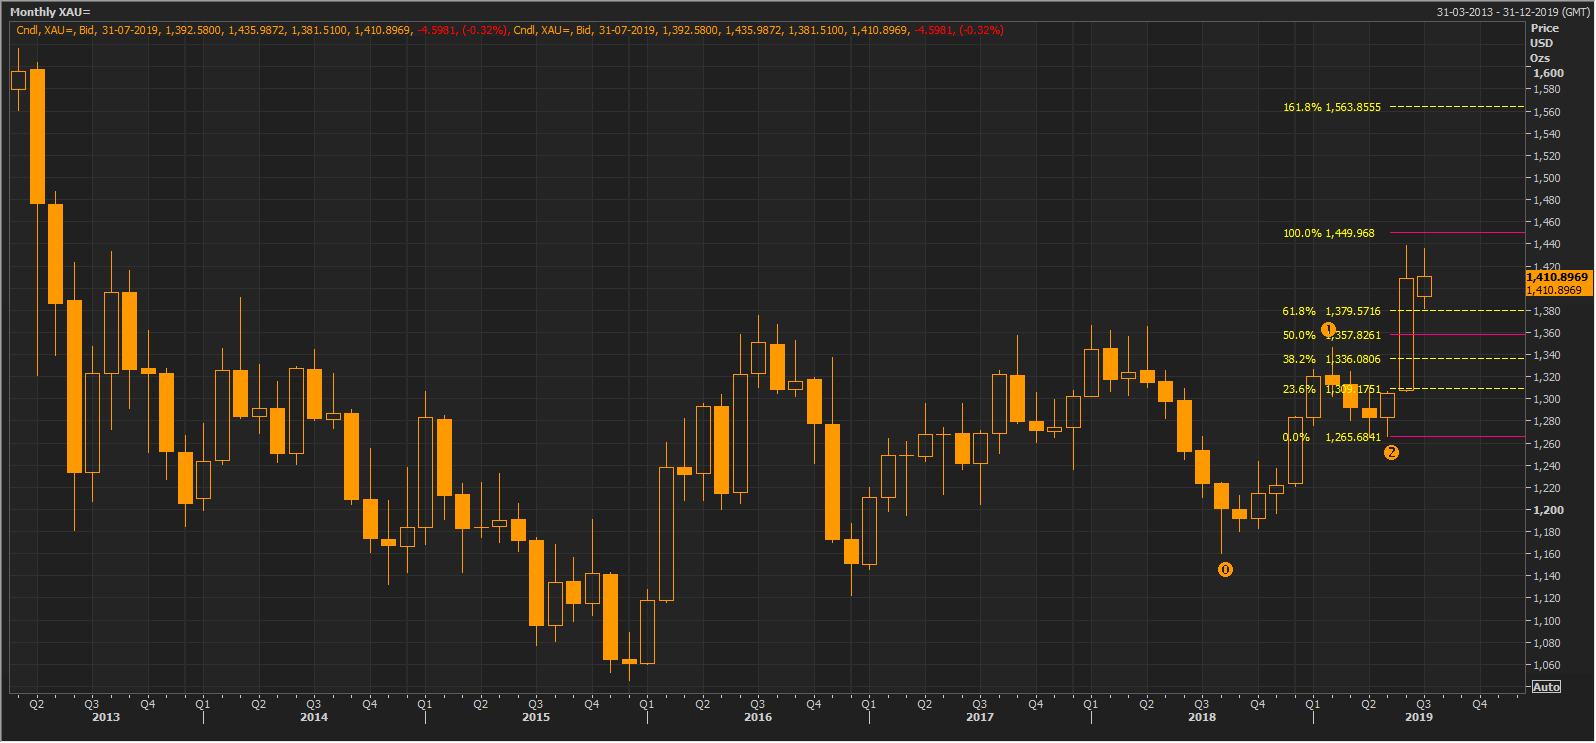
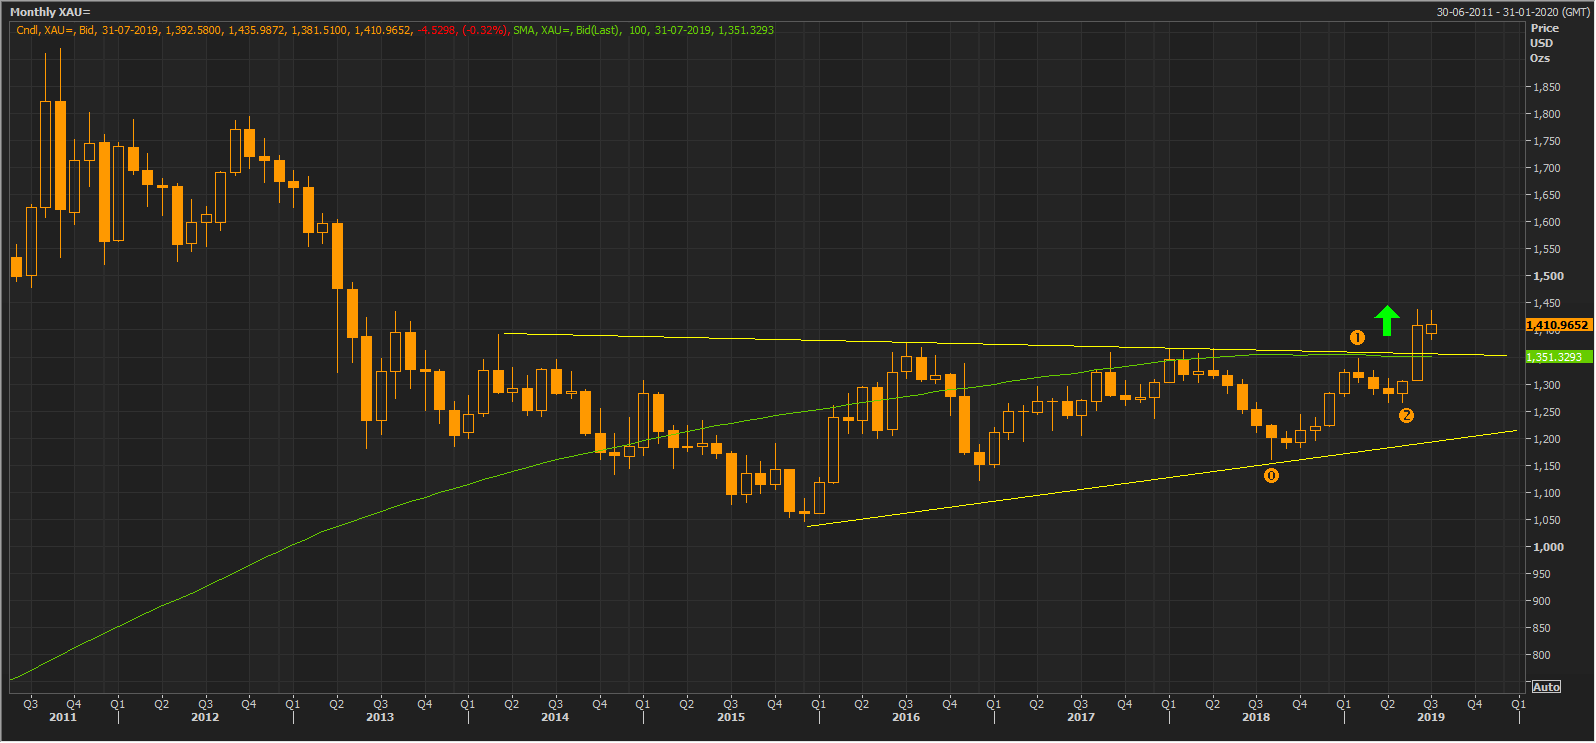 XAU Monthly Chart (Source: Thomson Reuters)
On a monthly chart, the gold prices have breached its consolidation range, and now the prices are expecting to take the support of downward sloping yellow trendline, which would be at approx. US$1352. On following the chart shown above, we can observe that the 100-days simple moving average is reaching to the level of US$1351.3293, which is near its support level of US$1352.
The investors should keep a close eye around the level of US$1352, as a break below and sustain above the level would decide further price actions in it.
 XAU Monthly Chart (Source: Thomson Reuters)
On further connecting the Fibonacci Series through the projected level marked as 0,1,2 on the chart shown above, we could notice that the 100.0 per cent projected level of the series is at US$1449.968, which could offer resistance to the gold prices in future.
Investors should monitor the level of US$1449.958 closely, as a break-above or failure to do so would decide further action in gold prices.
Gold on a Daily Chart:
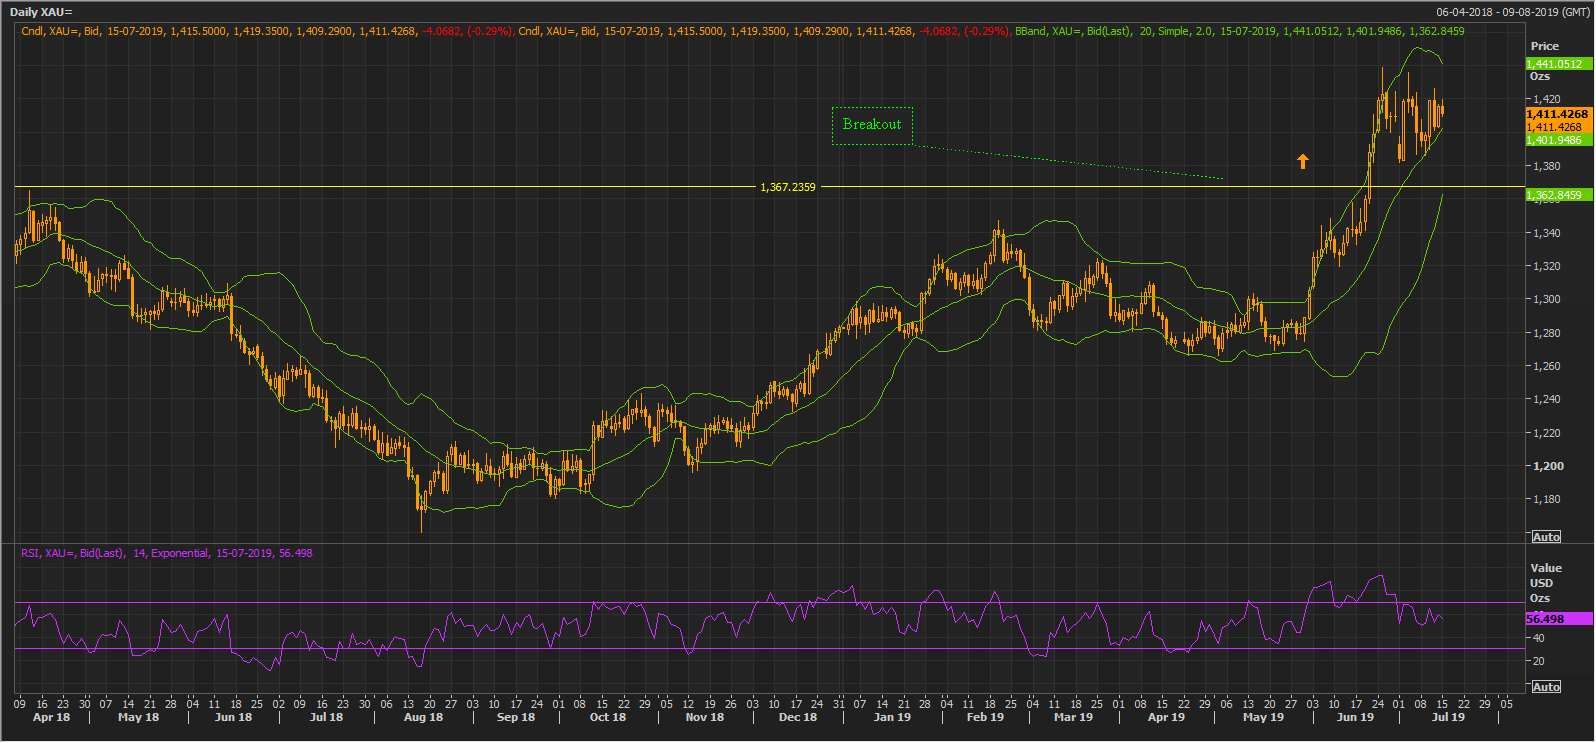 XAU Daily Chart (Source: Thomson Reuters)
On a daily chart, the gold demonstrated a break-out from the level of approx. US$1368 and rose to mark a high of US$1438.99 (Dayâs high on 25th June 2019). On the technical indication counter, the 14-days Relative Strength Index of gold is showing a positive indication, which underpins the bull strength in the market.
The gold prices are currently taking short-term support of the median of 20-days Bollinger Band, which is at approx. US$1402. The twice of the return Standard Deviation bands, i.e., the upper band and the lower band are at US$1441.0512, US$1362.8459 respectively, which in turn, could act as a short-term hurdle and support for the gold prices.
In a nutshell, the primary support for gold is intact at US$ US$1352 for the medium-term, while the short-term support is intact at US$1402, and investors should closely monitor both the levels to reckon the future price movements.
Disclaimer
This website is a service of Kalkine Media Pty. Ltd. A.C.N. 629 651 672. The website has been prepared for informational purposes only and is not intended to be used as a complete source of information on any particular company. Kalkine Media does not in any way endorse or recommend individuals, products or services that may be discussed on this site. Our publications are NOT a solicitation or recommendation to buy, sell or hold. We are neither licensed nor qualified to provide investment advice.
