


Crude oil prices are tumbling in the international market as investors are discounting gloomy global outlook amid increased production and export capacity of the United States.
The Brent oil prices fell from the level of USD 71.95 (Dayâs high on 16 September 2019) to the level of USD 59.21 (Dayâs low on 30 September 2019), which in turn, represented a fall of over 17.70 per cent.
The prices had previously rose to the level of USD 71.95 post the attack on Aramcoâs crude oil processing facilities.
To Know More, Do Read: Aramco Fire Fuelled ASX Energy Stocks; United States SPR to Rebalance the Supply Chain?
Geopolitical Factors Exerting Pressure on Oil Prices
In the recent United Nations General Assembly, the Iranian premier indicated that Iran could ink a nuclear pact if the United States removes the sanctions on its oil. In response, the United States President indicated a slight softening, which raised speculation in the oil market, and crude oil prices were deeply discounted by the investors and speculators.
To Know More, Do Read: ASX-Listed Energy Players Caught Between Global Leadersâ Squabbling; Crude Under Speculative Selling
Apart from the possibility of an ease in Iranian sanctions, the weakness in global oil demand exerted further pressure on oil prices. The United States trade tussle with China intensified further when Washington announced the plan of delisting Chinese stocks from the national stock exchanges.
The further heightening of the U.S-China trade spat raised pessimism among the global investors over the beleaguered global economic conditions, which further fanned the market speculation of weakness in oil demand.
The weakness in demand was indicated by the sudden fall in the United States oil exports despite higher domestic production. The total imports of oil in the United States also declined amid fall in refinery inputs for the week ended 20 September 2019, which in turn, further substantiated the low oil demand speculation.
The United States Oil Scenario
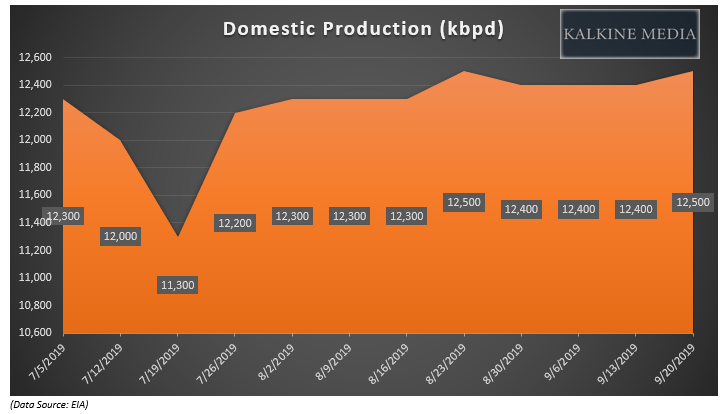
The domestic production in the United States inched up by 0.1 million barrels a day for the week ended 20 September 2019 to stand at 12.5 million barrels a day. The domestic oil production is steady and averaging around 12.4 million barrels a day since May 2019.
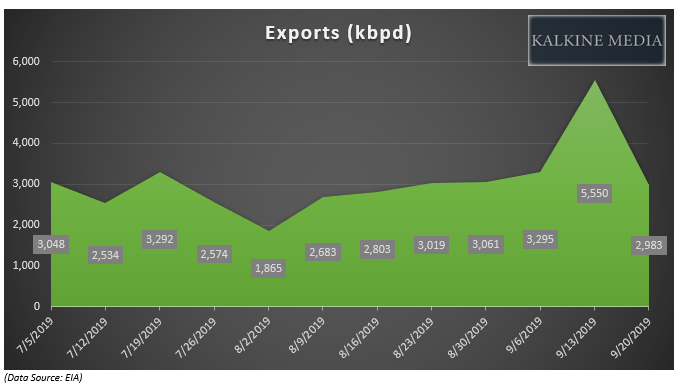
The exports from the United States plunged by 2,567 thousand barrels a day to stand at 2.9 million barrels a day for the week ended 20 September 2019 against the previous week exports of 5.5 million barrels a day.
The refinery inputs in the United States stood at 16.51 million barrels a day for the week ended 20 September 2019, down by 193 thousand barrel a day from the previous weekâs refinery inputs of 16.7 million barrels a day.
The fall in exports level coupled with higher domestic production and fall in refinery inputs indicated ample supply and decline in demand, which led to the fall in crude oil prices.
The plunge in crude oil prices in the international market as expected exerted pressure on ASX-listed oil & gas explorers. The oil prices act as the benchmark of other liquid fuels such as LNG, propane, etc., and a fall in the benchmark oil prices exerts pressure on LNG prices as well.
To Know More, Do Read: Understanding Crude Oil Dynamics Through The Web Of Global Influencers
ASX-Listed Oil & Gas Explores
Woodside Petroleum Limited (ASX: WPL)
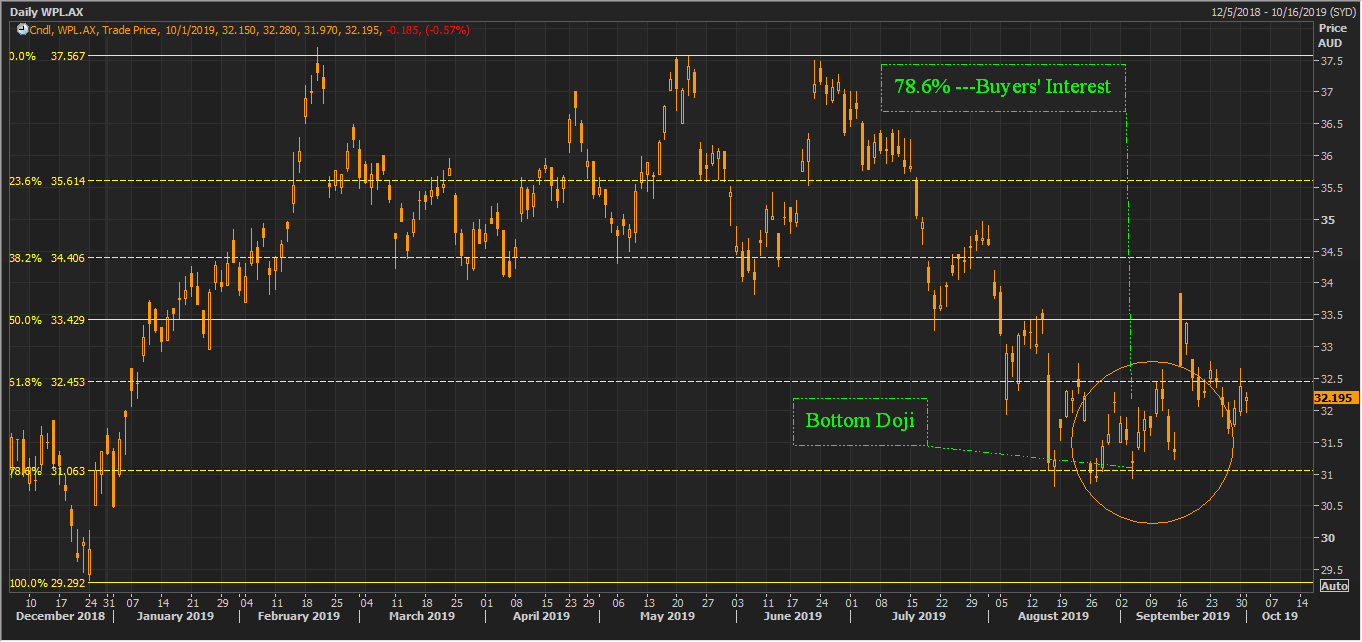
WPL Daily Chart (Source: Thomson Reuters)
On the daily chart, the price actions formed a Doji candle, which represented an indecisive market; however, the 78.6 per cent corrected level of the primary rally, which typically generates buyersâ interest played out, and the prices breached the high of the Doji candle.
Post accumulating buyersâ interest, the stock rose above the 50.0 per cent projected level at $33.429.
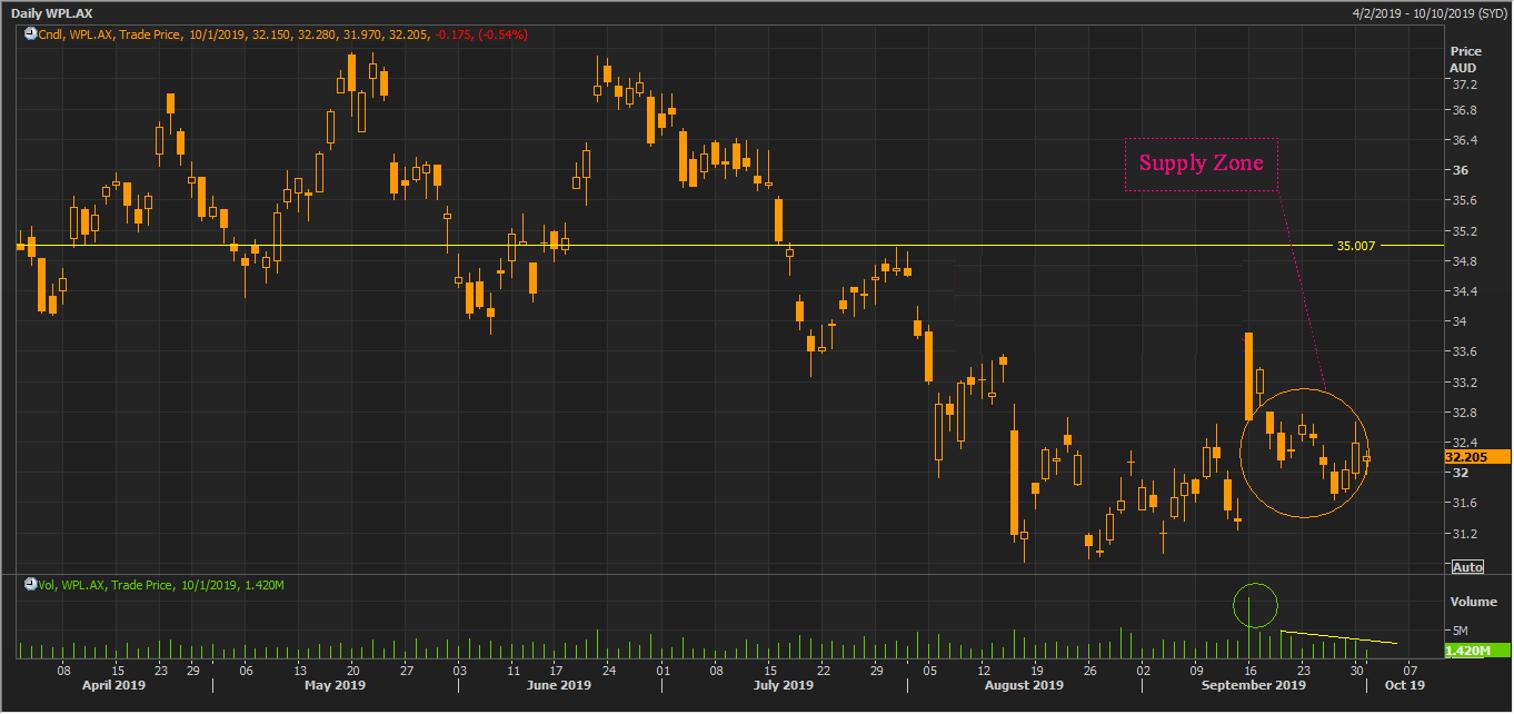
WPL Daily Chart (Source: Thomson Reuters)
After crossing the 50.0 per cent of the Fibonacci retracement, with a massive gap up opening backed by heavy volumes, the sellers took charge, and the prices soon filled the gap signaling bears taking charge.
The stock is currently trading in a well-supplied zone, with a primary hurdle of approx. $35.007.
The downtrend in the volume represents a decline in buyersâ strength; however, the investors should monitor the price actions closely as a break and sustain above the primary hurdle with an increase in volume could change the direction of the trend ahead.
WPL Daily Chart (Source: Thomson Reuters)
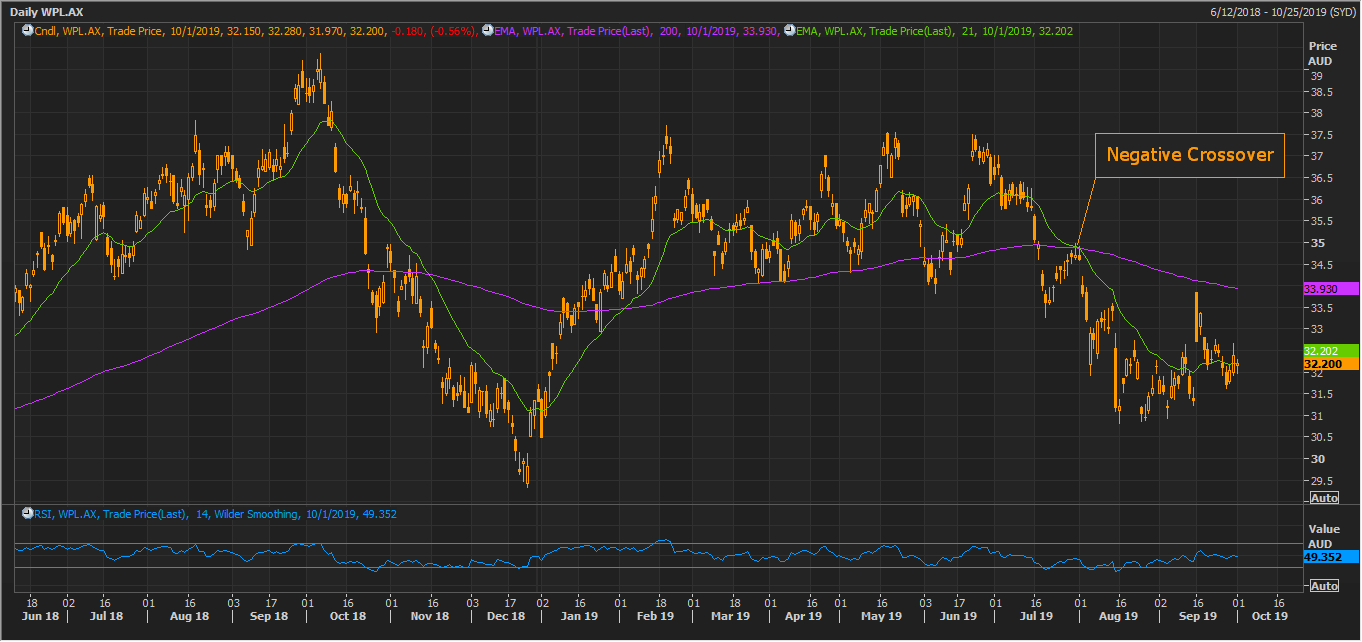
On the daily chart, the moving averages are showing a negative crossover with a 21-day exponential moving average crossing the 200-day exponential moving average from above, giving strength to the current downtrend.
The 14-day Relative Strength Index is at 49.352 and is below the mean of 50, and a further fall would take the stock to the oversold zone from where a rise in prices with spiked volume could give an early indication of a short-term trend reversal.
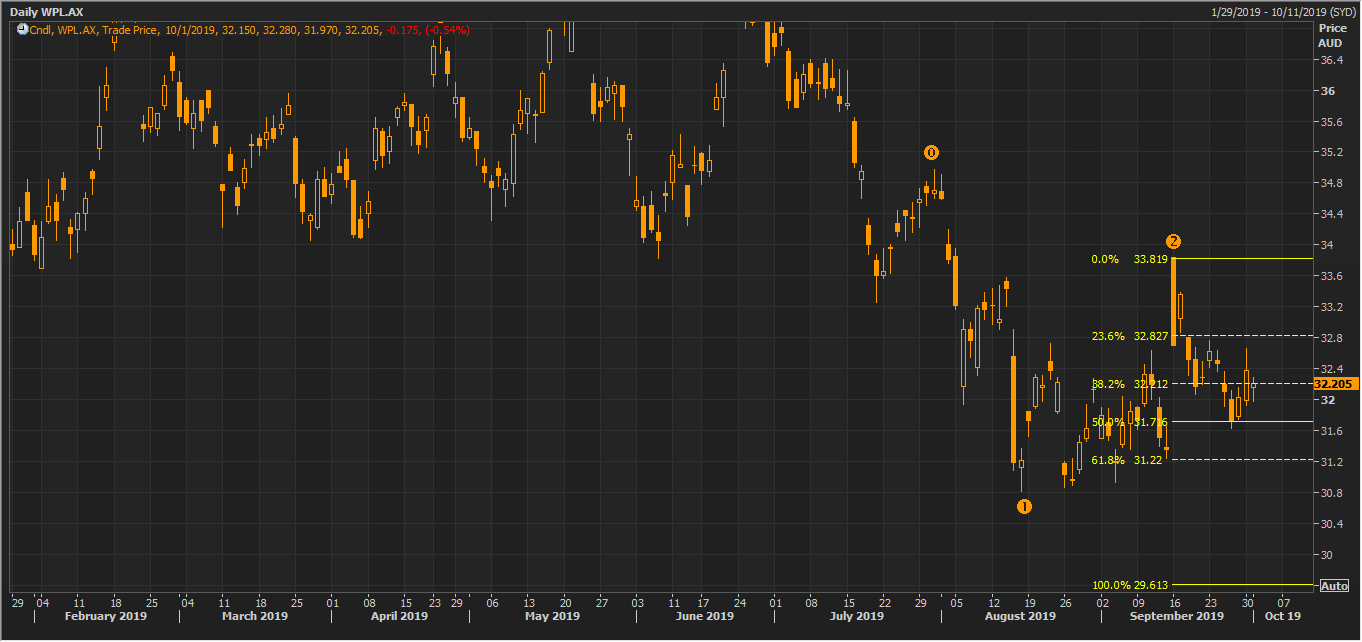
For now, the stock is dominated by the bearsâ strength and the downside Fibonacci projections are as below:
WPL Daily Chart (Source: Thomson Reuters)
The Fibonacci series, which is projected from the points marked as 0,1 and 2 are at 23.6 per cent ($32.82), 38.2 per cent ($32.21), 50.0 per cent (31.71), 61.8 per cent (31.22), and 100.0 per cent (29.61), which would hold true until the prices cross the high of the candle marked as (2).
Other ASX-listed oil & gas explores such as Oil Search Limited (ASX: OSH), Carnarvon Petroleum Limited (ASX: CVN) are currently in the similar supply zone, and a recovery in crude oil prices might induce buyersâ interest in these stocks.
Risk for Oil Short Sellers
- The current risk surmounting the oil short-seller is the reluctance of Iranian premier to give up on the nuclear ammunition and high expenditure on the research and development of nuclear weapons, which in turn, could influence the possible negotiation between the United States and Iran and could again raise concerns on the supply.
- Another risk for the oil short sellers is the Saudi Arabiaâs claim over its ability to quickly restore the Aramco production to the normal levels, which the market players are skeptical about amid fall in shipment grades of state-owned Aramcoâs oil.
To wrap up, the ample supply and damaged demand amid gloomy global conditions have exerted tremendous pressure on the crude oil market, and the shares of ASX-listed oil & gas explorers are currently under pressure and trading in the supply zone.
However, any recovery in crude oil prices amid any geopolitical events or fundamental chain could support the stock prices again of the ASX-listed oil & gas explorers, but for now, expect few, many ASX-listed-oil & gas explorers remain under pressure.
Disclaimer
This website is a service of Kalkine Media Pty. Ltd. A.C.N. 629 651 672. The website has been prepared for informational purposes only and is not intended to be used as a complete source of information on any particular company. Kalkine Media does not in any way endorse or recommend individuals, products or services that may be discussed on this site. Our publications are NOT a solicitation or recommendation to buy, sell or hold. We are neither licensed nor qualified to provide investment advice.
