


Iron ore prices took a hit in the international market despite the inventory shortage. The prices of iron ore future of the most actively traded September series on the Dalian Commodity Exchange (DCE) fell from the level of RMB 911.50 (Dayâs high on 3rd June 2019) to the level of RMB 816 (Dayâs low on 5th June 2019).
The prices plummeted more than 10 per cent from its recent peak after the China Iron and Steel Association (CISA) mentioned that a national department would investigate the soaring iron ore prices and would crack down on the price monopoly.
However, the prices recovered from its low of RMB 816 to RMB 845 before ending the session on 5th July. But the prices again saw a gap down opening yesterday in China, where the DCE September series started the dayâs session at RBM 829.0, down by almost 1.90 per cent from its previous settlement.
Likewise, the iron ore futures of the most actively trading July contract on the Chicago Mercantile Exchange fell from the level of US$123.19 (as on 2nd July 2019) to the level of US$117.10 (as on 5th June), down by almost 5 per cent over the pressure from the Chinese market.
Supply Dynamics: The iron ore inventory across the 35 significant Chinese ports declined for the 11th consecutive week to shoot-up the prices in the international market. As per the data, the iron ore inventory across those ports stood at just 105.80 million tonnes on 5th July, down by 0.82 per cent or 0.88 million tonnes from its previously reported level.
The fall of 0.88 million tonnes in the inventory marked a multi-week consecutive decline, and the inventory declined by 34.72 million tonnes from a year ago.
The shortfall in inventory coupled with stagnant demand supported the iron ore prices, and the prices zoomed in the international market until recently.
Further on the supply side, the Australian Department of Industry and Innovation (DIIS) recently announced the expected export fall for 2019 from the Australian ports amid the domestic production loss from lousy weather.
China Steel: In June, Chinaâs stainless steel output stood at 2.34 million metric tonnes, down by 2.34 per cent from previous month amid lower production from mills due to cost concerns, which in turn, supported the steel prices in the domestic as well as in the international markets.
As per the market experts, the stainless steel across China is expected to inch up to 2.5 million metric tonnes in July, as the Chinese steel mills are again increasing the production amid higher steel prices in the market and better profit margins.
The Steel Rebar prices in the domestic market of China stood at RMB 4010 (as on 28th June), up by 3.08 per cent or RMB 120; while, the Steel HRC inched up by 3.43 per cent or RMB 130 to settle at RMB 3920 (as on 28th July).
Further Outlook: The high steel prices of rebar steel and better profit margins are expected to prompt the producers to ramp up the production in July. Apart from the falling inventory, another factor which supported the steel prices was the production cut in China at the beginning of July.
As per the industry experts, the planned maintenance of the steel mills in July is now expected to reduce the steel rebar production by more than 190k metric tonnes; however, the estimated production cut is far less than the previously anticipated volume of more than 440k metric tonnes.
The lower steel inventory coupled with higher profit margins of around 380 yuan per metric tonnes could again support the iron ore prices in the international market; however, the investors should keep a close eye on the actions of CISA formed committee, which contains a potential risk to the iron ore prices and could further lead to a possible short-term price correction.
Iron ore on Charts:
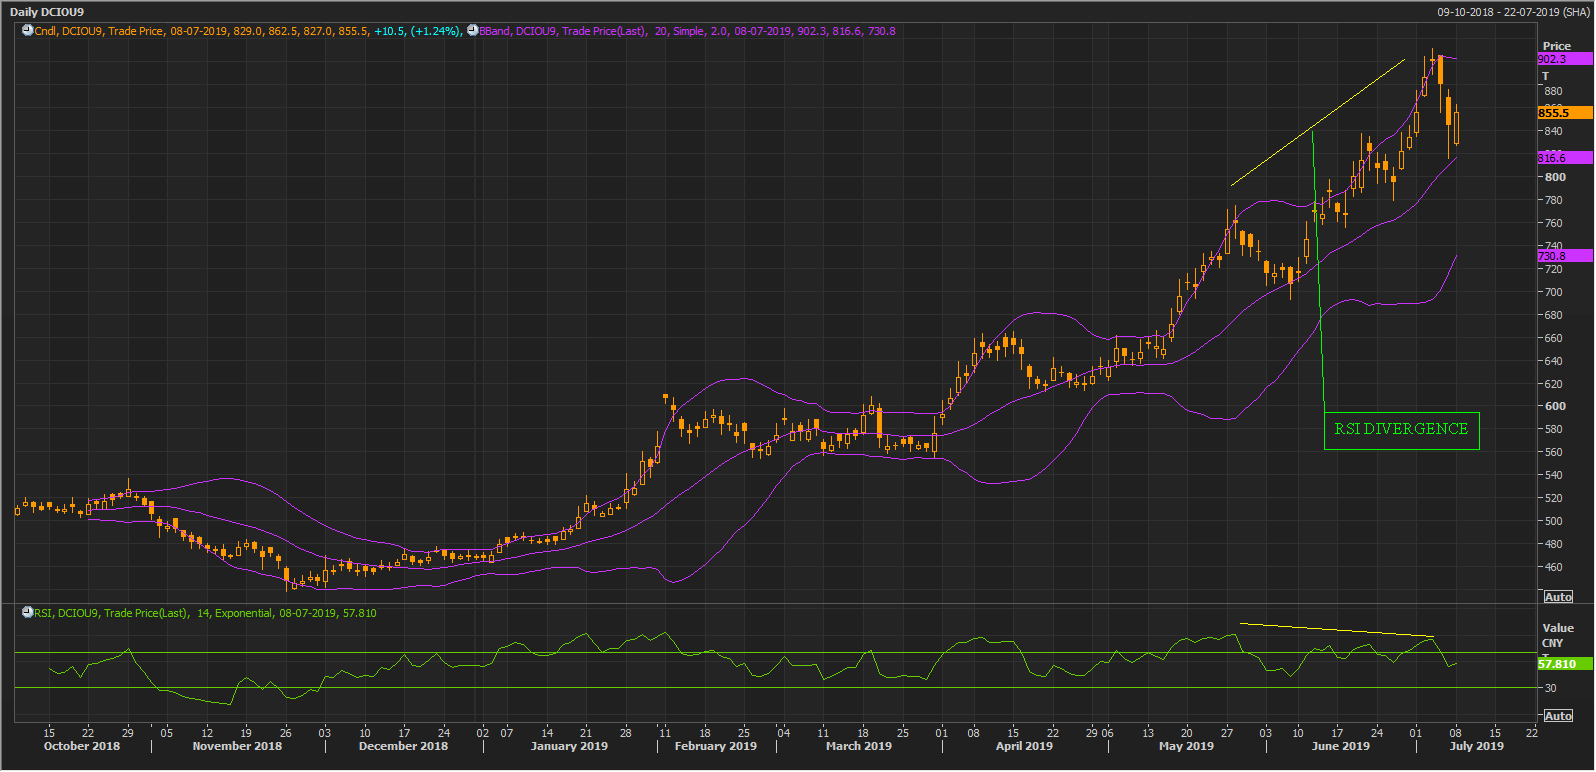 DCIOU9 Daily Chart (Source: Thomson Reuters)
On a daily chart, the iron ore prices are moving in a continuous uptrend; however, the prices have taken the hurdle of the standard deviation (upper purple line) of 20-days simple moving average. Post taking the hurdle the prices fell.
The 14-day Relative Strength Index and the price actions are showing bearish divergence, and it can be seen that the prices are moving in an uptrend, making higher highs and higher lows, while the 14-days smoothened Relative Strength Index is moving in a downtrend, making lower lows and lower highs.
Recently, the prices made a new high; however, the 14-days Relative Strength Index failed to do so.
Post understanding the iron ore movement and the demand and supply dynamics, let us now take a look over the Australian mammoth iron ore miners who capture a plethora of the Australian iron ore supply chain.
Rio Tinto(ASX: RIO)
Rioâs operations in the Pilbara region took a jab from the Tropical Cyclone Veronica, which in turn, caused a disruption in the companyâs daily operations and damaged the Pilbara projects, which supply the highly sought after Pilbara Fines iron ore.
Post witnessing the supply loss, Rio also declared a production halt amid compromised quality in its Pilbara Fines and coupled with an annual production loss, the production halt supported the iron ore prices in the international market.
The high prices supported the companyâs share on ASX, and Rio moved up and registered a new 52-week high in a continuous momentum until recently.
Rio Tinto, Iron ore, and S&P/ASX200:
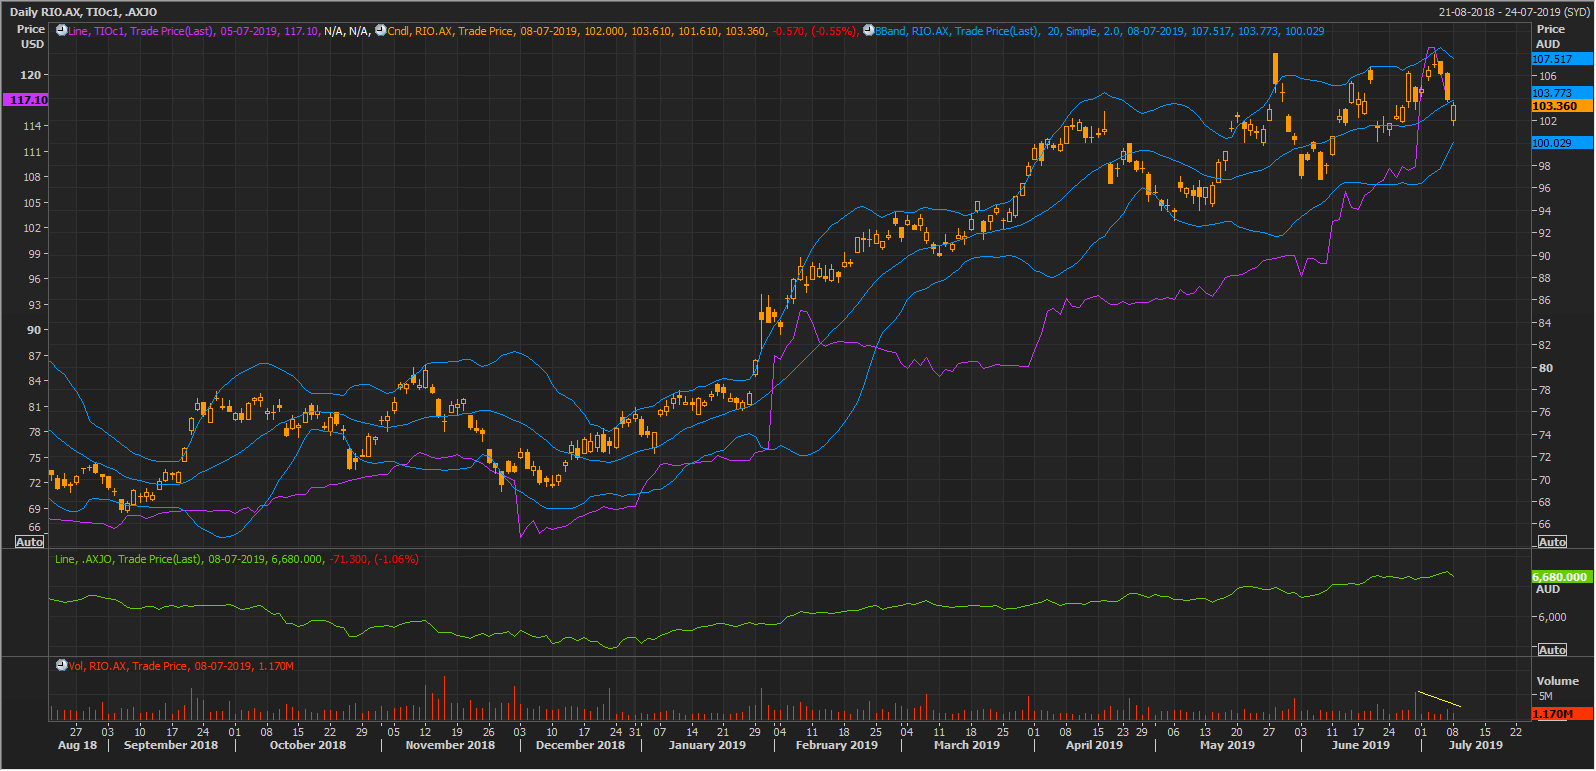 RIO,DCIOU9, AXJO Daily Chart (Source: Thomson Reuters)
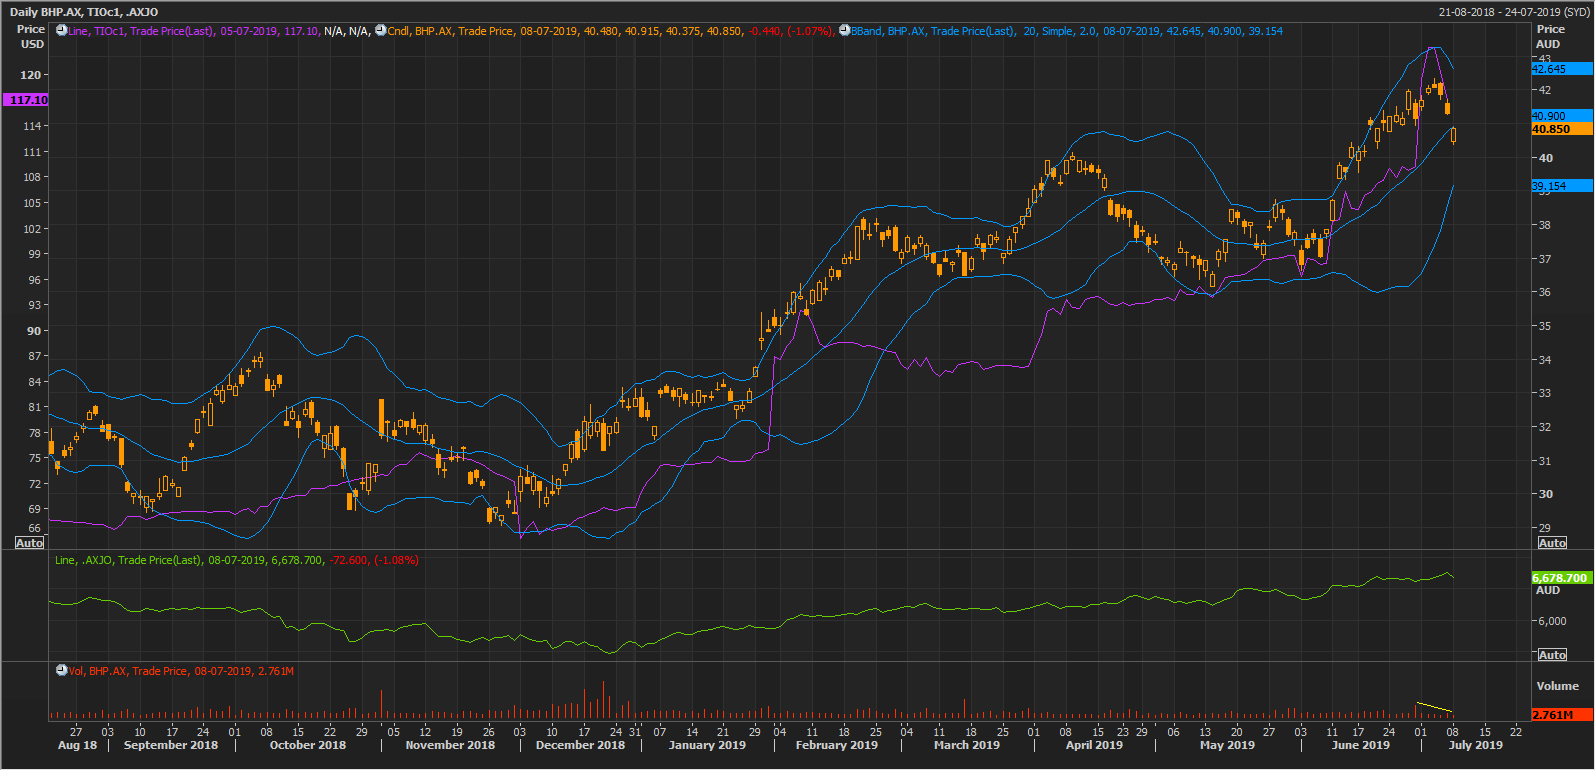
On the chart shown above, we can see that the share price of the company carefully traces the movement in iron ore. While the iron ore prices managed to cross the upper band (standard deviation) of 20-days simple Bollinger Band, the companyâs share failed to do so.
The share price of the company, when tracked against the S&P/ASX 200 Index, revealed that the shares of the company closely moves in tandem with the index, and in the past sixth month, Rio outperformed the index due to high total returns amid increased iron ore prices.
Rioâs 5-years monthly Beta against the market index stands at 0.97, which in turn, suggests that a one per cent move in the market brings about 0.97 per cent leap in the Rioâs share price. Supported by the rising index and high iron ore prices. Rio moved to make a new 52-week of A$107.940 (on 3rd July 2019)
Rio Status Quo:
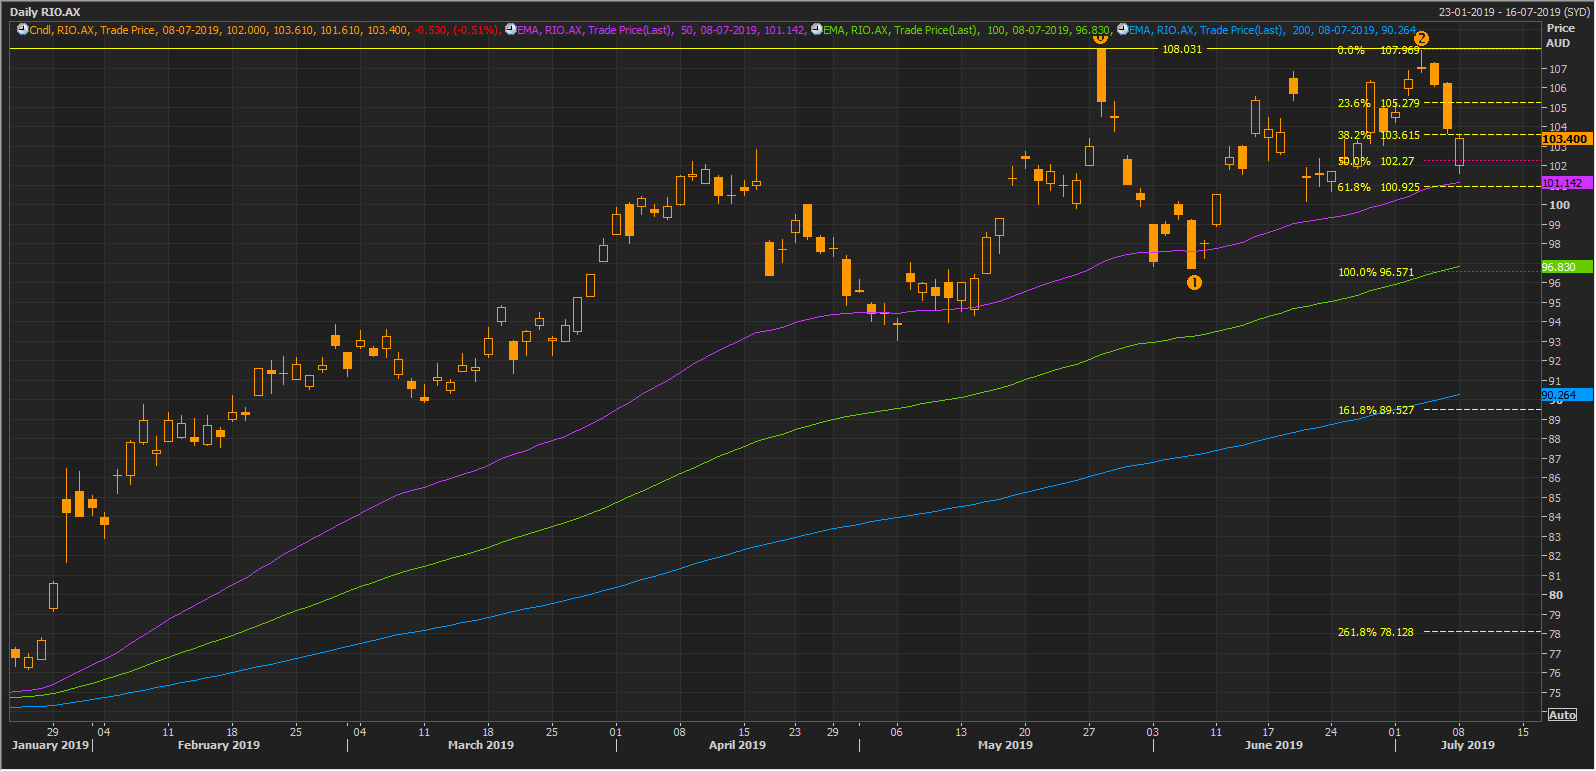 RIO Daily Chart (Source: Thomson Reuters)
On a daily chart, the share price of the company is now facing resistance around the level of approx. A$108. The recent plunge in iron ore dragged the Rioâs share as well; however, the price could take the initial support around the 61.8 per cent Fibonacci Series, which is at A$100.925, or around the 50-days exponential moving average (EMA), which is at A$101.142.
The second support remains intact at the 100 per cent Fibonacci Series (A$96.571), and 100-days EMA (A$96.830).
BHP Billiton (ASX: BHP)
BHPâs operation also took a hit from Veronica, and the company declared an annual production loss in the range of 6 to 8 million tonnes. Post the production loss the company also faced a lawsuit of US$5 billion in the Samarco case. However, the high iron ore prices hosted the share to trade on premium, and the total returns in the past sixth month outperformed the S&P/ASX 200 Index.
BHPâs 5-years monthly Beta against the market index stands at 1.19, which in turn, suggests that a one per cent move in the market brings 1.19 per cent leap in the BHPâs share price. Supported by the rising index and high iron ore prices. BHP moved to make a new 52-week high of A$42.330 (on 3rd July 2019).
 BHP,DCIOU9, AXJO Daily Chart (Source: Thomson Reuters)
On a daily chart, the share price of the company is in continuous uptrend, and the prices deviated less as compared to Rio and Iron ore from its 20-days simple moving average. The prices are now trading below the mean (20-days simple moving average) and could face initial resistance at the same level (A$40.900).
The Total Return Profile:
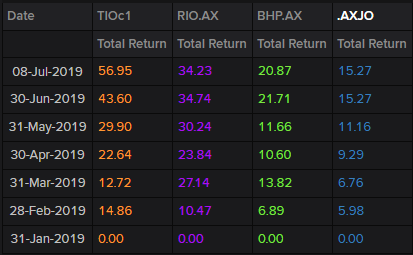
Total Return Profile (Source: Thomson Reuters)
When compared from the closing price of 31st Jan 2019 to the current market price, Iron ore prices (TIOC1) outperformed the total returns from other assets. The high iron ore prices also supported the share price of the Australian iron ore miners, which in turn, further supported the S&P/ASX 200 (AXJO) Index as well, since RIO and BHP form substantial contributors to the index construction.
The return from 31st Jan 2019 closing price to the current market price for Rio stands at 34.23 per cent, while BHP delivered 20.87 per cent and S&P/ ASX 200 delivered 15.27 per cent total returns.
Disclaimer
This website is a service of Kalkine Media Pty. Ltd. A.C.N. 629 651 672. The website has been prepared for informational purposes only and is not intended to be used as a complete source of information on any particular company. Kalkine Media does not in any way endorse or recommend individuals, products or services that may be discussed on this site. Our publications are NOT a solicitation or recommendation to buy, sell or hold. We are neither licensed nor qualified to provide investment advice.
