


Bitcoin prices tumbled in the international market, and the digital currency took a jab from the level of USD 13,764.0 (Dayâs high on 26 June 2019) post breaking out of a double top pattern on the daily chart.
Bitcoin Bloodbath
In the status quo, the prices again crashed substantially from its recent high of USD 12,307.0 (Dayâs high on 6 August 2019) to the present level of USD 8,045.9 (as on 30 September 2019 12:33 PM AEST), with a massive drop of over 17 per cent on 24 September 2019.
Also Read: Bitcoin Knocking Heaven Doors; Libra From Facebook Catches Investorsâ Eye
What Dragged the Prices Down?
The main reason for the Bitcoin plunge is believed by the market participants to be the liquidity decline instigated by the BITMEXâs exchange policy, that batches customersâ Bitcoin withdrawal requests and are processed only once at UTC 13:00, daily.
However, some market participants attribute the sudden fall in the hash rate to fall in Bitcoin prices. Hash Rate is a measure of the current amount of processing power consumed to mine new blocks. It basically measures a minerâs performance speed.
Furthermore, the charts were already indicating a bearish signal based on the recent pattern formation.
To Know More, Do Read: BrewDog Vouches For Bitcoin, While FED Raises Concerns; Whatâs Next For The Bitcoin?
Bitcoin Volatility
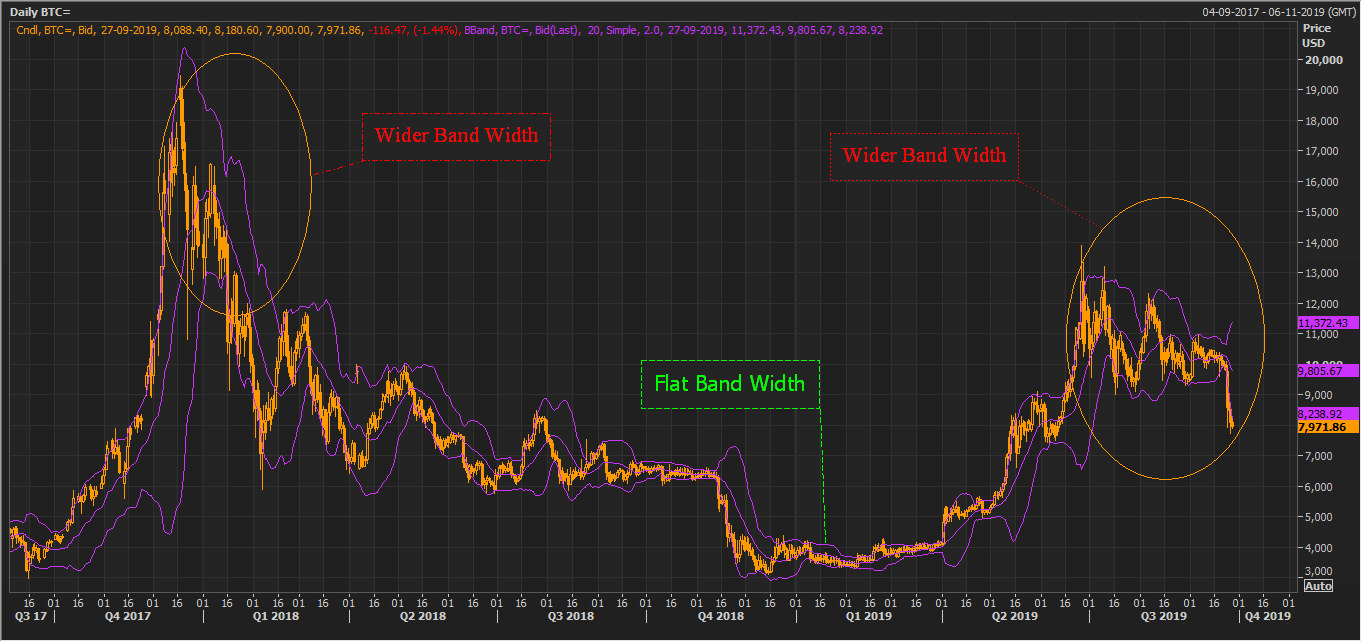
BTC Daily Chart (Source: Thomson Reuters)
Bitcoin is considered as a highly volatile digital asset amid its high intensity of price fluctuations. As seen on the daily chart, the gap between the upper and lower lines of the Bollinger Band remained large during the fourth quarter of the year 2017 that was the period when the various governments decided to ban Bitcoin as a mean of financial transaction (event).
The gap between the upper and lower lines of the Bollinger Band again widened recently over the liquidity tightening and decline in hash rate (event).
Bitcoin is typically considered risky due to its volatile nature. The high volatility makes Bitcoin a considerable asset among hedge funds and institutional funds; however, from a retail investorsâ POV, Bitcoin as an asset class is highly risky.
Thus, it becomes even more important that retail investors carefully consider their entry and exit strategy while building positions in risky assets such as Bitcoin.
Also Read: How to Buy Bitcoin at Deep Discounts?
What to Expect Ahead?
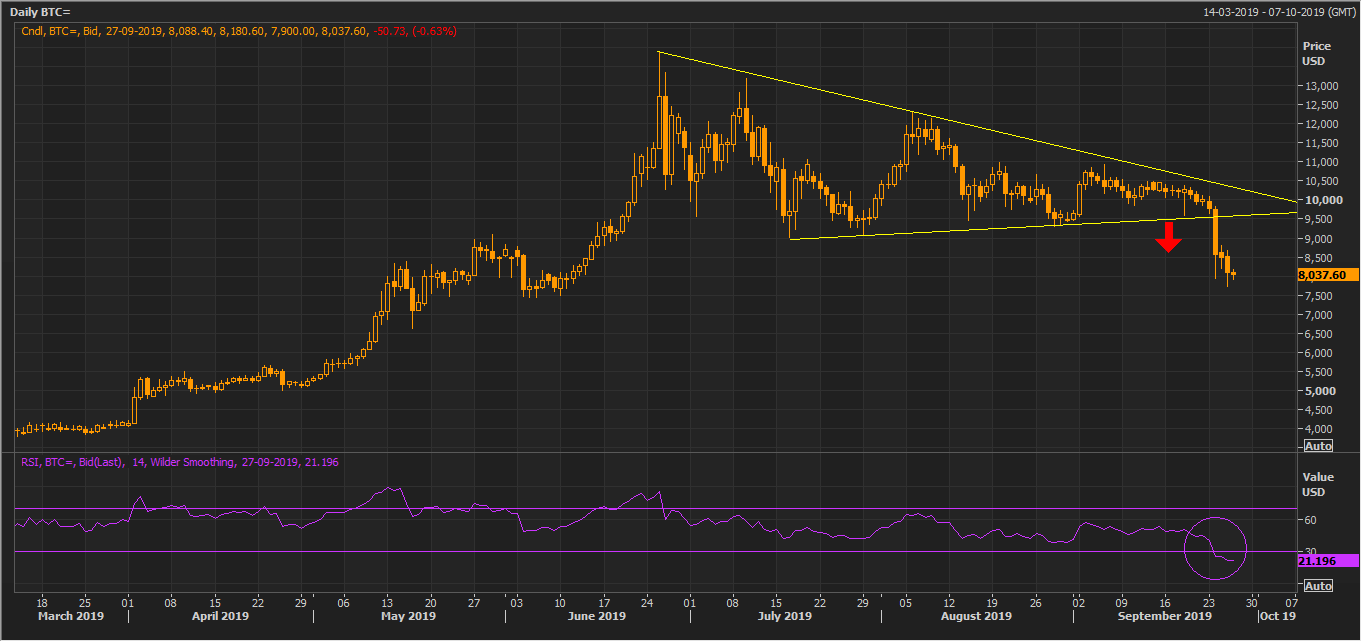
BTC Daily Chart (Source: Thomson Reuters)
On the daily chart, the Bitcoin prices broke out of a symmetrical triangle formation at the top, which is a bearish signal. The prices might rise again to retest the breakout levels. During the retesting of the breakout levels, if the prices are unable to cross and sustain above the upward sloping line of the symmetrical triangle, it could instigate a further selling in Bitcoin.
The market witnessed heightened volume during the breakout of the symmetrical triangle, which, in turn, indicates that the bears are dominating the bulls in the current market conditions.
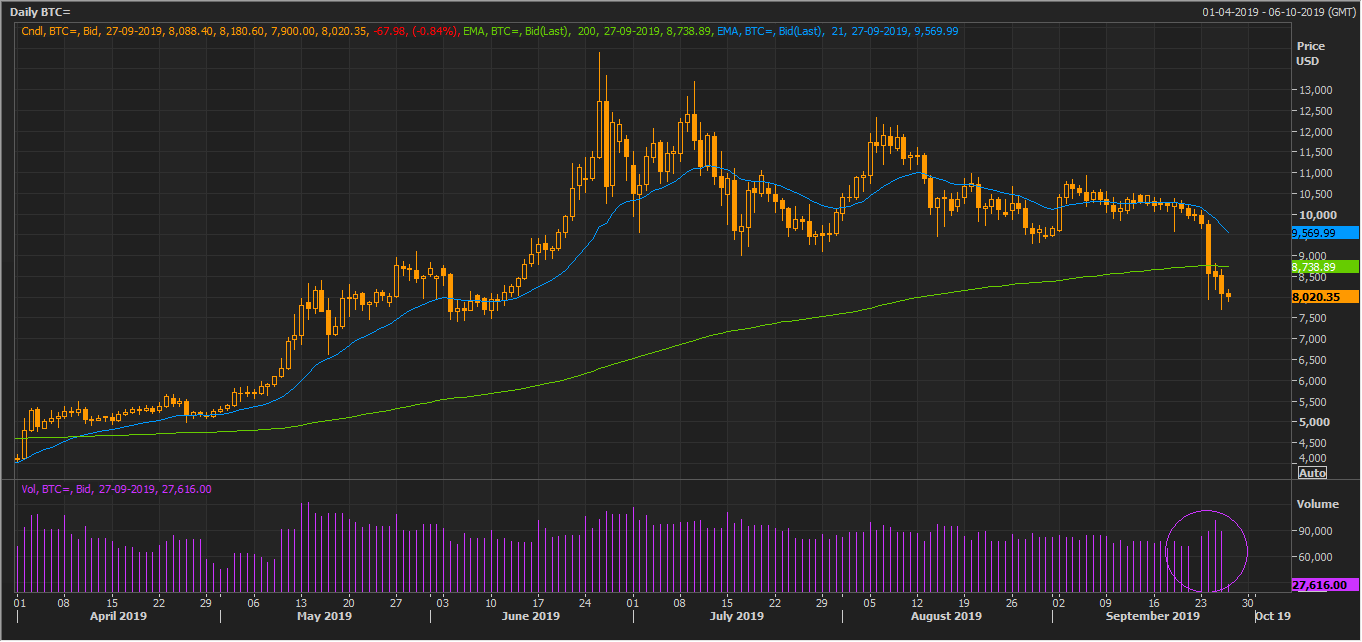
BTC Daily Chart (Source: Thomson Reuters)
On further following the daily chart, we can observe that the prices are currently trading below the 21- and 200-days exponential moving averages, which are at USD 9,569.99 and USD 8,738.89, respectively. However, the prices have not yet resulted in negative crossover of these moving averages.
The primary hurdle for the prices remains intact at the 200-day exponential moving average (USD 8,738.89). The 21-day day exponential moving average (USD 9,56.99) could act as the second hurdle for the Bitcoin prices.
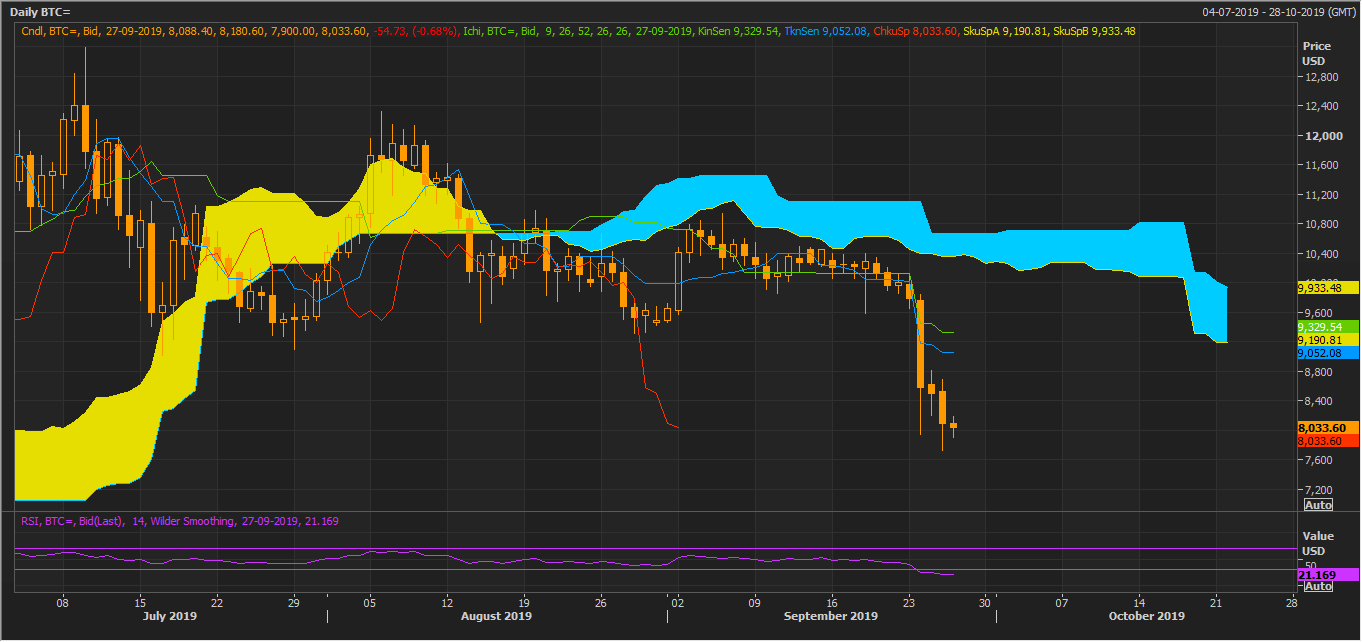
BTC Daily Chart (Source: Thomson Reuters)
On applying the Ichimoku on the daily chart, we can notice that the Bitcoin is currently trading below the Span A, which is at USD 9,190.81 and is the mean of the conversion and base lines. The Span A is below Span B, which is at USD 9,933.48 and is the mean of 52 days high and low, which indicates that the asset is moving in a downtrend.
The conversion line (navy blue), which is the mean of 9 days high and low is at USD 9,052.08 and is crossing the base line (green), which is at USD 9,329.54 from above (negative crossover).
The Ichimoku clouding technique is giving a strong bearish signal as the negative crossover took place below Span A.

BTC Daily Chart (Source: Thomson Reuters)
Post applying the Fibonacci series on the daily chart, we can observe that the price action formed a downside wave, which is connected through the points marked as 0,1 and 2 on the chart shown above. The Bitcoin prices reached the downside 100.0 per cent projected level of USD 8,152.23.
Bitcoin prices are currently taking the support of 100.0 per cent projected level, and investors should monitor this level closely as a break and sustain below the same could exert further downside pressure on the prices.
However, if the prices do not break below the 100.0 per cent projected level, they could take support from the current levels to establish a short-term uptrend to retest the symmetrical triangle breakout levels.
The projected level would hold true until the prices cross the high of the candle marked as (2).
Also Read: Guide To Bitcoin And Stocks Specializing In Blockchain Technology
Bitcoin Price fall and ASX-listed- Digitalx Limited
Post the fall in Bitcoin prices the ASX-listed Bitcoin trading software provider Digitalx Limited (ASX: DCC) is taking a hit in the market.
The share prices of the company dropped from its recent high of $ 0.070 (Dayâs high on 6 August 2019) to the level of $ 0.025 (Dayâs low on 5 September 2019), which in turn, marks a fall of over 64 per cent.
The share prices of the company are in a downtrend from the level of $0.440 (high in January 2018) amid a massive drop in Bitcoin prices.
As on 30 September 2019, DCC is trading at $ 0.028, down by 3.45 per cent as compared to its previous closing price (as at AEST: 1:18 PM).
Disclaimer
This website is a service of Kalkine Media Pty. Ltd. A.C.N. 629 651 672. The website has been prepared for informational purposes only and is not intended to be used as a complete source of information on any particular company. Kalkine Media does not in any way endorse or recommend individuals, products or services that may be discussed on this site. Our publications are NOT a solicitation or recommendation to buy, sell or hold. We are neither licensed nor qualified to provide investment advice.
