


Bitcoin prices are knocking the sky doors on Bitfinex over various possible reasons. The prices rose from the level of US$3426.9 (low in February 2019) to the current month high of US$13764.0 (Dayâs high on 26th June 2019).
The sudden upsurge in the digital asset underpins the growth of more than 300 per cent in less than five months. As we mentioned in our previous article, the retail investors in the bull run remained sceptical while the fund houses saw the bull rally coming and stayed invested in the digital segment.
Post the rise, market players such as investors and speculators are looking for the reason of a bull run, while many industry experts are filling the void with different opinions; in our view the underlying factor is the basic fundamental of the Bitcoin, i.e. â Higher Acceptanceâ.
The Bitcoin prices could be gaining traction as many countries are accepting the token as a legitimate mean for financial transaction, and apart from that, an increase in the number of the service providers in the digital sector is fanning the Bitcoin popularity among the investing community.
Service providers such as the San Juan Mercantile Bank & Trust International are addressing the security concerns related to the Bitcoin holdings by providing custodial services. Other service providers such as Cboe and CME Group are adding to the liquidity and hedging in the digital asset world by providing an extensive range of future contracts.
The increased acceptance coupled with inched up security sense among the investing community and the potential of the currency to de-centralise the monetary control is what that could be attracting the shark investors into the digital asset.
Recent Developments:
In the status quo, along with Bitcoin prices, another digital currency- Libra is catching the investorsâ eye. Libra is a newly launched cryptocurrency by the American Social Media giant- Facebook. Many market participants believe that the foot-in from the American mammoth is supporting the Bitcoin as it is inching up the mainstream acceptance of the Bitcoin in terms of both financial transaction and storage of wealth.
However, both the currencies are different in terms of their collateralization. While Libra is secured by a reserve of real assets such as bank deposits, Bitcoin is backed by no underlying assets, and investors should consider the difference between both the currencies before entering into any long or short positions in the market.
Global Cues and Central Banks Stance:
Global Cues:
As Bitcoin is a concept for de-centralization; global uncertainty could also have supported the prices in the international market. The recent escalation in the tension between the United States and Iran caused erosion of trust between the nations, and as Bitcoin is free from government and financial institutions, any breach of trust among the governments could support the Bitcoin prices.
Central Banks Stance:
Recently, the Federal Reserves in the United States and European Central Bank indicated towards the decline in interest, which in turn, has depreciated the domestic currencies of both the United States and Europe.
Dollar Plunge:
After rallying to the level of 98.37 in May 2019, the Dollar Index marked the hefty monthly loss in June, and the index value fell to the present low of 95.84 (Dayâs low on 25th June 2019). The devaluation in dollar supported the other dollar-denominated currency pairs, which also includes the Bitcoin. Likewise, the Euro prices took a jab in the international market.
DXY on Charts:
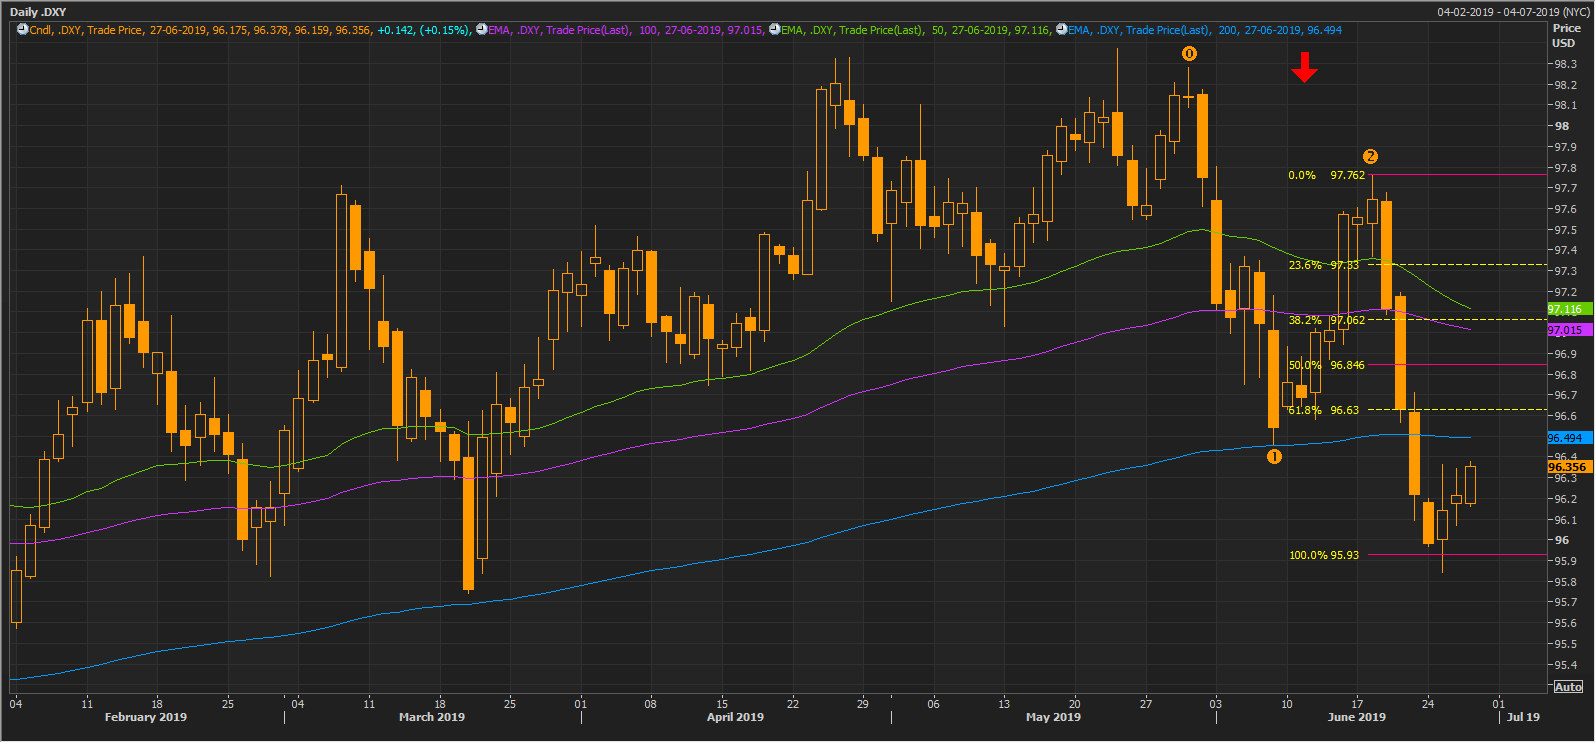
DXY Daily Chart (Source: Thomson Reuters)
On following the chart shown above, we can see that the index value plunged and slipped below the 50,100, and 200-days exponential moving averages, which are currently at 97.116, 97.015, and 96.494. However, post connecting the coordinates (0,1,2) of the Fibonacci Series, it can be noticed that the prices are currently taking the support of 100.00 per cent projected level, which is at 95.93.
BTC/USD on Charts:
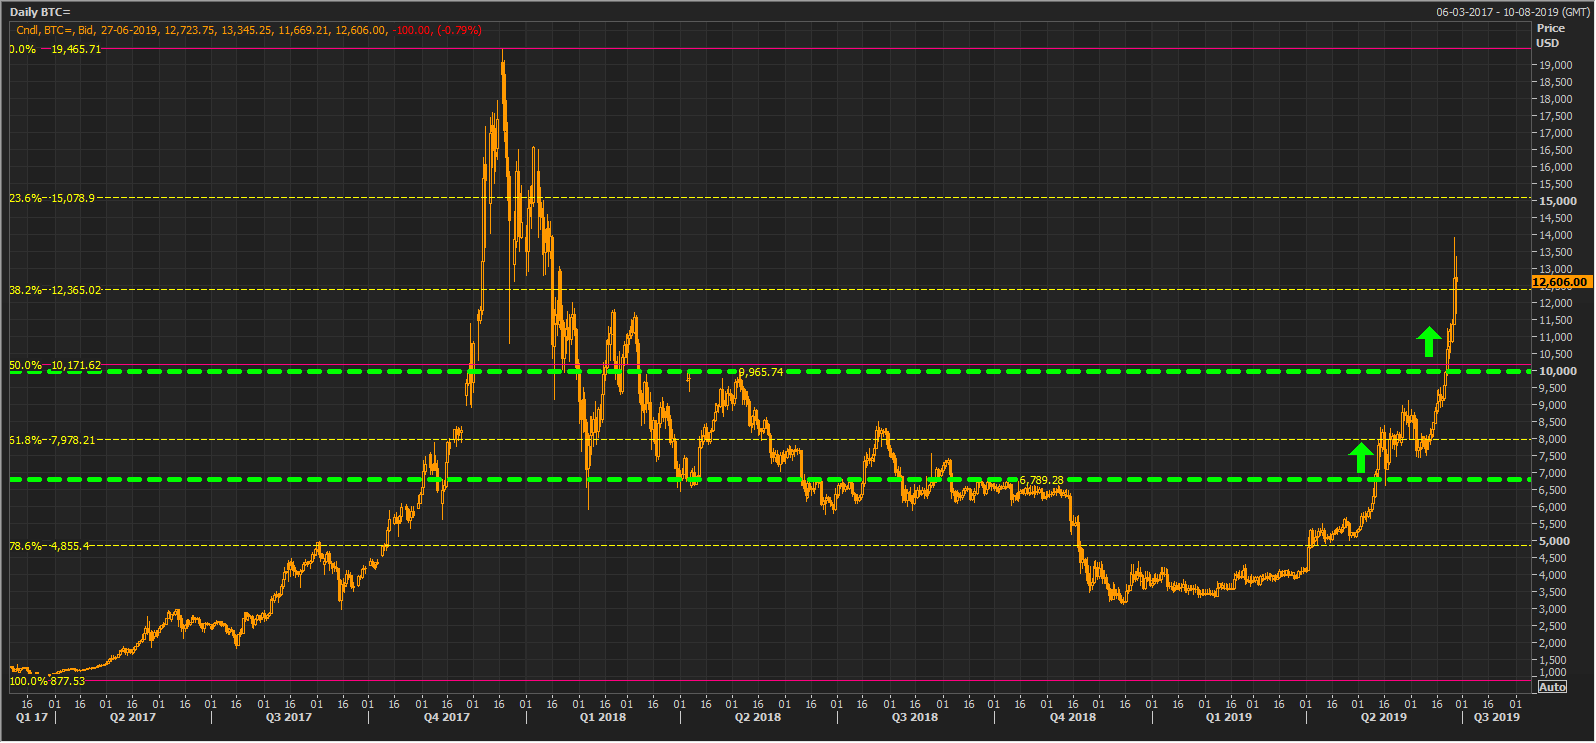
BTC/USD Daily Chart (Source: Thomson Reuters)
On the chart shown above, we can observe that the BTC prices breached its first hurdle of US$6,789.23, and post that the prices of the currency rose to bypass another resistance offered by the level of US$9,965.74.
After crossing both the hurdles, the price spiked and rallied to the present high of US$13764.0 yesterday.
In our previous article on Bitcoin, we presented the technical level, and the chart from our previous article is as:
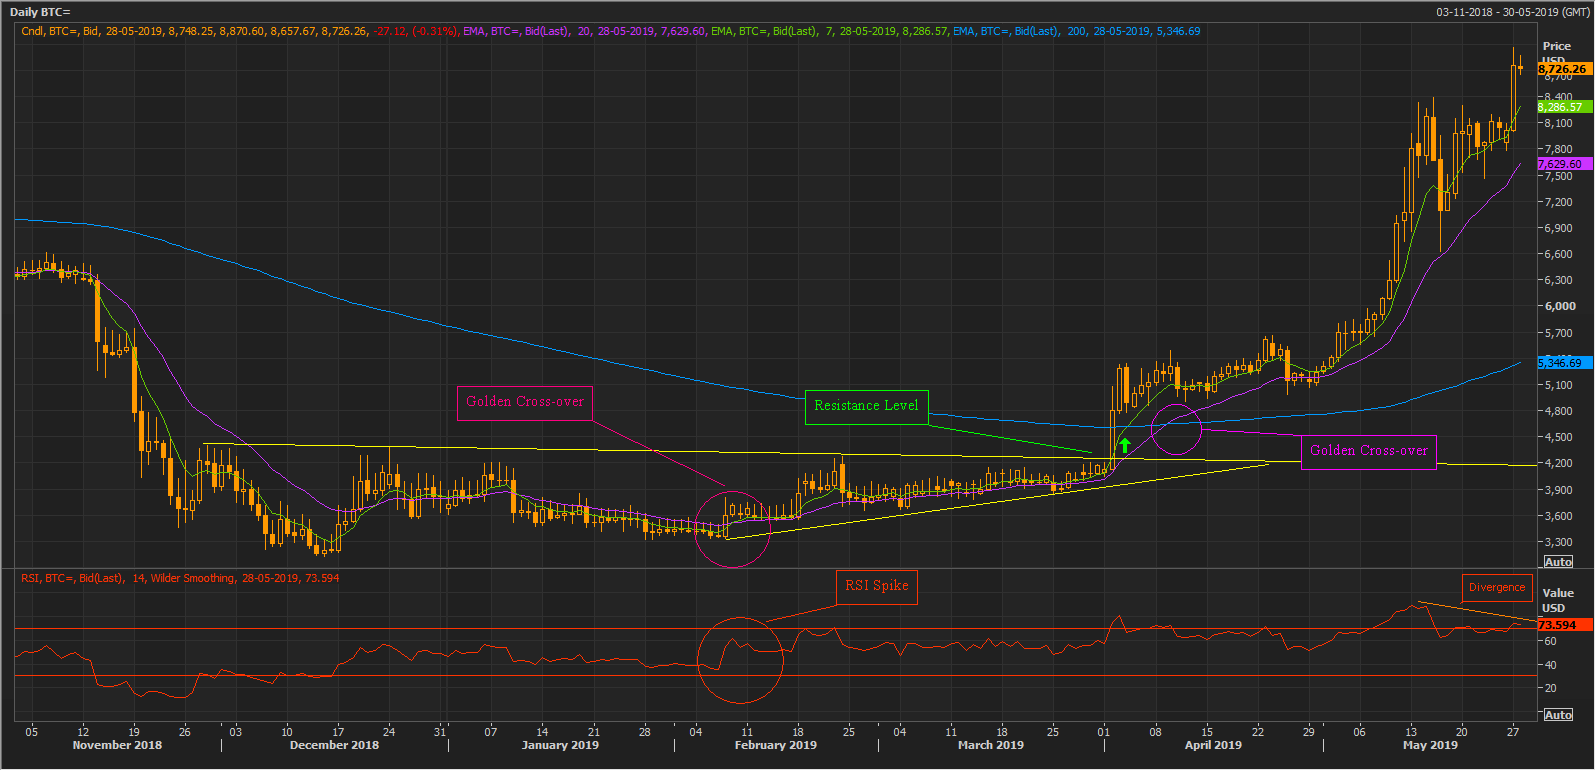
BTC/USD Daily Chart (Source: Thomson Reuters)
Before crossing its first resistance level, the prices of Bitcoin were trapped in a narrow range; however, the RSI spike and the Golder Crosses (bullish signal) suggested bull interest, and in the status quo, the prices rose significantly. We further cautioned the investors about the possibility of a price correction ,and post rallying, the prices corrected as well.
BTC/EUR on Charts :
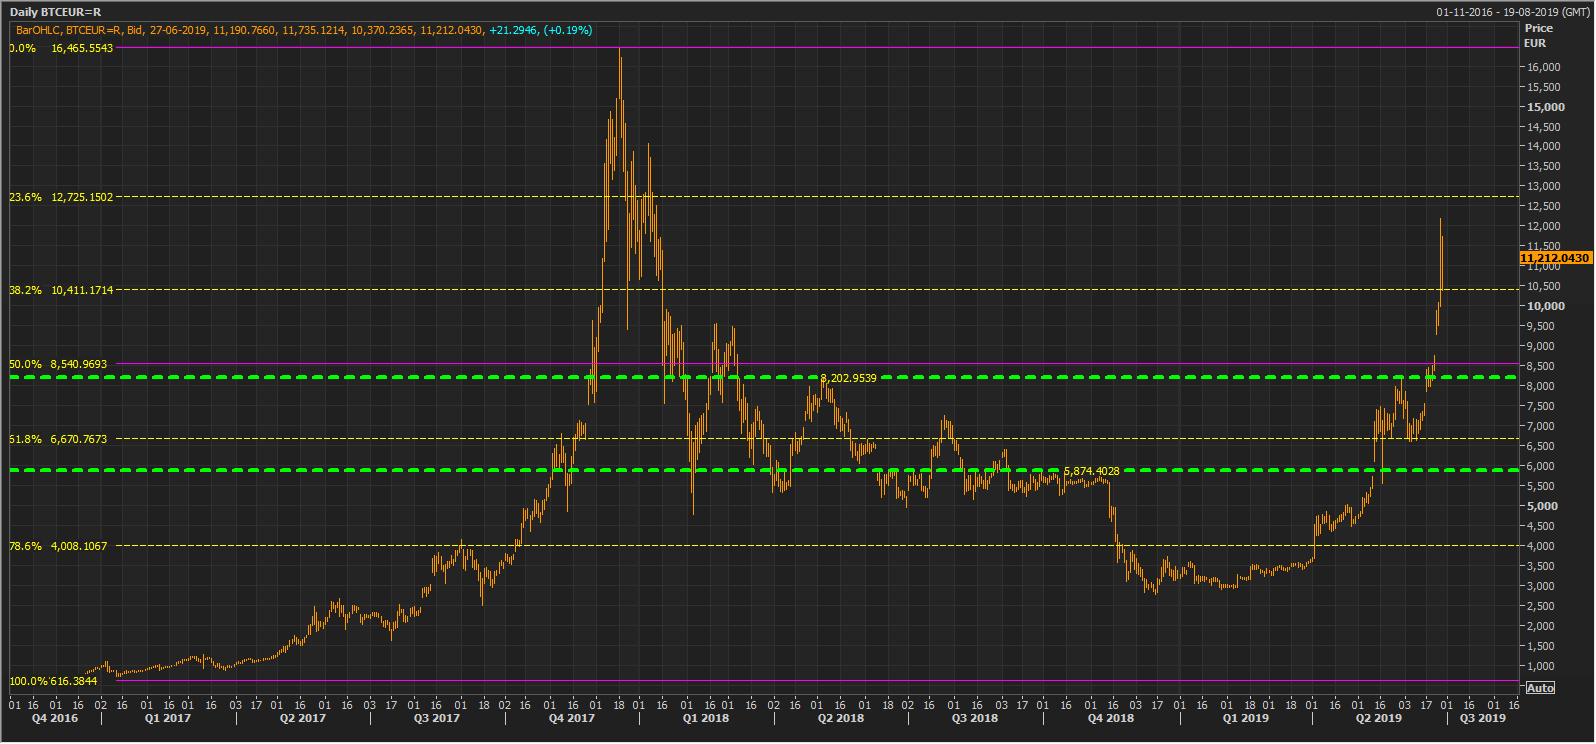
BTC/EUR Daily Chart (Source: Thomson Reuters)
The Bitcoin denominated in Euros also followed the same trend and the price action remained similar to the dollar-denominated Bitcoin amid depreciated Euro.
Return Profile:
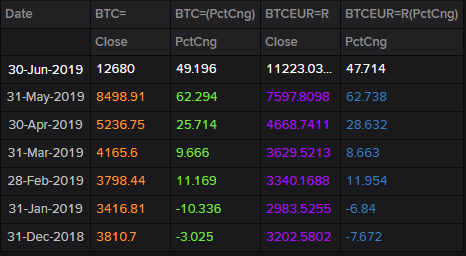
Monthly Return Comparison (Source: Thomson Reuters)
On comparing the monthly return profile of both BTC/USD and BTC/EUR, we can see that the Bitcoin delivered substantial monthly return from January 2019. The return from both BTC/USD and BTC/EUR almost remains the same with a little variation, which could be accounted for the change in cross currency rates.
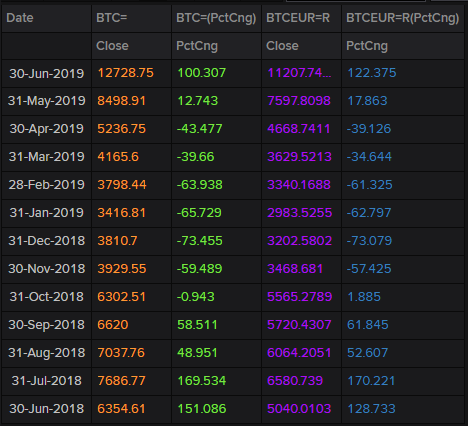
Also, Bitcoin almost doubled in value from its June 2018 closing price of US$6354.61 to the present value of US$12728.75 (as on 27th June 2019 4:17 PM AEST), which in turn, marks a return of 100 per cent in one year.
However, investors should not be charmed with the massive return from the Bitcoin, as the Bitcoin market is volatile and a higher percentage in loss and profit is common to high volatility assets. While we see a return of 100 per cent in one year, we should not undermine the fact that Bitcoin plunge from its December 2017 high of US$19891.0 to December 2018 low of US$3216.1 marked a decline of more than 83 per cent in one year.
Future Outlook:
Many crypto analysts in the market believe that the Bitcoin now contains the potential of reaching an all-time high of US$100,000; however, investors should remain cautions before entering the market as such assets mark a high percentage change over events.
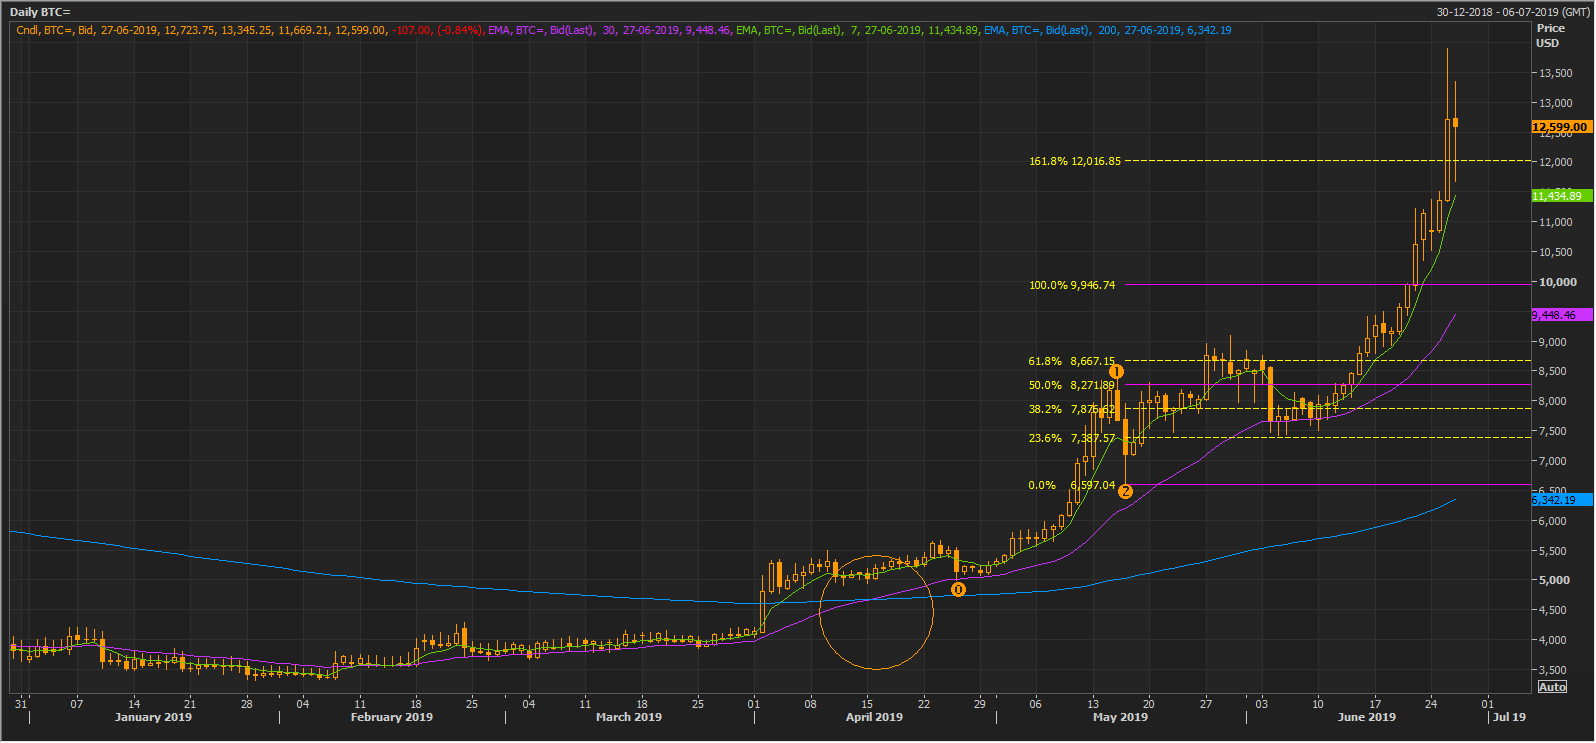
BTCUSD Daily Chart (Source: Thomson Reuters)
On a daily chart, the prices recently marked an emergence of a Golden Cross (bullish signal) of 200 and 30-days exponential moving average. The cross-over is marked with an orange circle on the charts shown above.
However, post connecting (0,1,2) the Fibonacci Series, we can see that the prices have crossed the 161.8 per cent projected level, which in turn, could notice a profit booking activity.
In a nutshell, the higher acceptance, the emergence of many service providers in the digital sector, global uncertainties, and interest rate decline, jointly supported the Bitcoin prices, which ignited an up-rally.
Disclaimer
This website is a service of Kalkine Media Pty. Ltd. A.C.N. 629 651 672. The website has been prepared for informational purposes only and is not intended to be used as a complete source of information on any particular company. Kalkine Media does not in any way endorse or recommend individuals, products or services that may be discussed on this site. Our publications are NOT a solicitation or recommendation to buy, sell or hold. We are neither licensed nor qualified to provide investment advice.
