


Investors tend to buy stocks looking at the dividend history or the track record of dividend yields. A consistent distribution of dividend implies that the subject company is earning profits from its existing operations. Recently, Reserve Bank of Australia has cut interest rate by 0.25% and the current interest rate stands at lowest level of 0.75%. Impact of interest rate fluctuations are industry specific. To beat this effect, investors may choose good dividend-yield stocks over fixed deposits. We will be discussing two stocks which have robust dividend yields as recorded in the recent past. Letâs have a look at SGR and SCG along with the key highlights of these companies.
The Star Entertainment Group Limited
The Star Entertainment Group Limited (ASX: SGR) operates in gaming and entertainment business and focuses on resort and hospitality services. SGR controls several resorts like the Star Sydney, Treasury Brisbane and the Star Gold Coast. The company controls Gold Coast Convention and Exhibition Centre on behalf of the Queensland Government and has investments in several strategic joint ventures.
Key Performance highlights for the year ended 30 June 2019: SGR announced its FY19 financial results wherein the company posted net revenue at $2,158.1 million as compared to $2,084 million in FY 18 while statutory NPAT was reported at $198 million as compared to $148.1 million in FY18. EBITDA before significant items came in at $552.8 million, higher by 14.1% from prior corresponding period. The company reported cash and cash equivalents at $114.3 million, Property, plant and equipment at $2,779.8 million and net assets at $3,740.9 million as on 30 June 2019. Net Cash inflows from operating activities were reported at $411.4 million, net cash outflow from investing activities at $433 million while net cash inflow from financing activities came in at $25.6 million. During the year the business reported Unique VIP customers up by 10% y-o-y and International Premium Mass turnover up 19% on prior corresponding period.
Domestic revenue during early 1HFY20 depicts a cautious consumer environment but is showing signs of improvement over 2HFY19. The company is able to maintain higher VIP volumes while other players in the segment are struggling with the same.
The Board of Directors have declared a fully franked final dividend of 10 cents for each equity share held, bringing the total for the year to (fully franked) 20.5 cents per share..
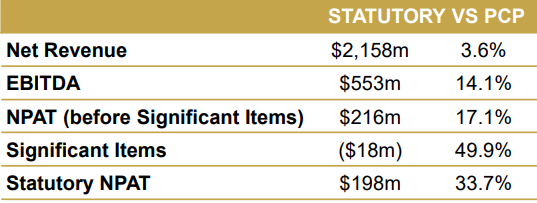
FY19 Financial Highlights (Source: Companyâs Reports)
Sydney Segment: This segment reported Net Revenue on statutory basis at $1,308.3 million, 0.5% lower on prior corresponding period (pcp) while statutory EBITDA was reported at $307.6 million, up 7.6% on pcp. The segment reported flat numbers on y-o-y on overall visitation while PGR was higher by 12.4% y-o-y. MGF was affected by capital works during the year. Operating costs during the year reduced 2.9% from FY18 aided by higher domestic volumes and increase in wages, which was nullified by reduced international gaming volumes. Slots revenue increased by 3.4% while tables revenue was up 4.0% on pcp followed by 1.3% y-o-y lower non-gaming revenue. The segment reported 6.8% higher hotel operations cash revenue was offset by impact from F&B refurbishments. The segment reported 2% decline in Unique VIP customers followed by a decline in spend per visitor.
Queensland Segment: This segment reported Net Revenue on statutory basis at $849.8 million, up 10.5% y-o-y while EBITDA came in at $245.2 million, up 23.5% on y-o-y basis aided by growth from all segments. The segment reported improved Visitation at 1.3% higher while Gold Coast up 3.0% y-o-y. Queensland reported slots revenue at 2.9% higher while the PGR segment was up by 8.7% and the segment reported gains in market share by Gold Coast and Brisbane. The segment reported 3.9% higher Tables revenue while PGR volumes up 5.8% on prior corresponding period. In Non-gaming, revenue up 2.4% y-o-y and flat hotel cash revenue offset by F&B growth. Operating costs were up 4.9% on increased domestic and international gaming volumes.
Stock update: The stock of SGR closed at $4.370, down 0.907% as on 2 October 2019. The market capitalization of the stock stands at $4 billion and total shares outstanding at 917.32 million. The stock is available at a price to earnings multiples of 20.42x while annualized dividend yield stands at 4.65%. The stock has generated returns of 5.76% and 5.5% during last three months and six months, respectively.
Scentre Group
Scentre Group (ASX: SCG) operates in long-term ownership of shopping centers such as retail units where customers can purchase their necessary commodities. Since the establishment of the business the group has aggregated more than 1,400 new retail brands in its portfolio with a focus on experience-based usages.
On 1 October 2019, SCG notified that it has bought 451,481 number of own shares at a price consideration of $1.77 million under the share buyback program.
Key Performance highlights for the Half Year ended 30 June 2019: SCG announced its first half yearly results for FY19 wherein, the company reported Income at $994.6 million, up 5% on prior corresponding period (pcp) while funds from operations came in at $676.2 million, as compared to $657.2 million on pcp. EBIT during the first half came in at $952.1 million, higher by 5.2% on pcp. The business reported total property investments at $37,461.7 million as compared to $39,101.1 million on H1FY18. Total assets and net assets were reported at $40,055.5 and $23,797.3 million respectively. The company added 118 new brands to the portfolio, while 117 existing brands grew their store network. The company joint ventured a 50% share in Westfield Burwood for $575 million, representing a premium to book value. The company Issued â¬500 million ($800 million) of long-term bonds during the half-year followed by a security buy-back program of up to $800 million. The company reported annual in-store sales across the portfolio to more than $24 billion which represents more than 7% of all retail sales in Australia. Average annual specialty in-store sales increased from $1.29 million to $1.52 million per store, representing a growth of 3.2% per annum.
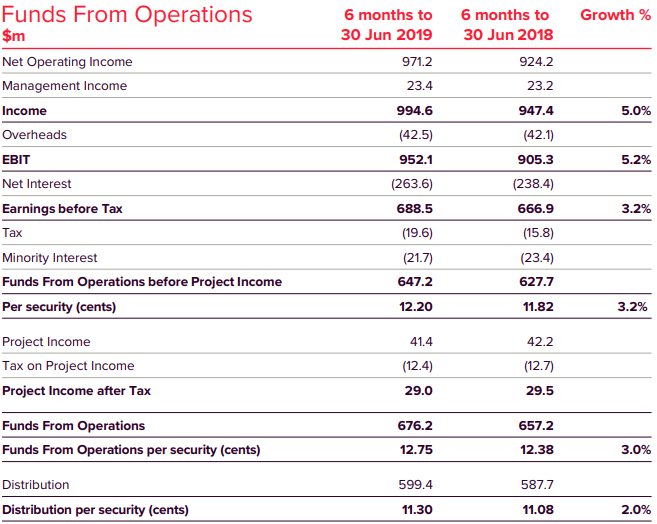
FY19 Financial Highlights (Source: Companyâs Reports)
Outlook for 2019: SCG highlighted that FFO growth per security is estimated at 0.7% including the impact of the transactions announced in the first half-year. The estimation excludes expected positive earnings impact of up to $800 million security buy-back program. The Board of Directors forecasted dividend distribution for 2019 at 22.60 cents per security, a growth of 2% over prior corresponding period.
Stock Update: The stock of SCG closed at $3.940, down 0.253% as on 2 October 2019. The market capitalization of the stock stands at $20.99 billion and total shares outstanding at 5.31 billion. The stock is available at a price to earnings multiples of 13.39x while the annualized dividend yield stands at 5.67%. The stock has generated returns of 1.8% and -2.6% during last three months and six months, respectively.
Disclaimer
This website is a service of Kalkine Media Pty. Ltd. A.C.N. 629 651 672. The website has been prepared for informational purposes only and is not intended to be used as a complete source of information on any particular company. Kalkine Media does not in any way endorse or recommend individuals, products or services that may be discussed on this site. Our publications are NOT a solicitation or recommendation to buy, sell or hold. We are neither licensed nor qualified to provide investment advice.
