


Dividend yield analysis is an important tool used in the valuation of a stock. The companies with high dividend yields are generally considered good in terms of paying dividends. However, one must also understand that, many times companyâs do carry inflated dividend yields caused by sudden decrease in the price.
WAM Capital Limited (ASX:WAM)
Investment management company, WAM Capital Limited (ASX:WAM) reported operating profit after tax of $14.5 million for the year ending 30 June 2019. The companyâs Board recently declared a fully franked final dividend of 7.75 cents per share, taking the full year dividends to 15.5 cents per share. The final dividend has a record date of 18 October 2019 and a payment date of 25 October 2019.
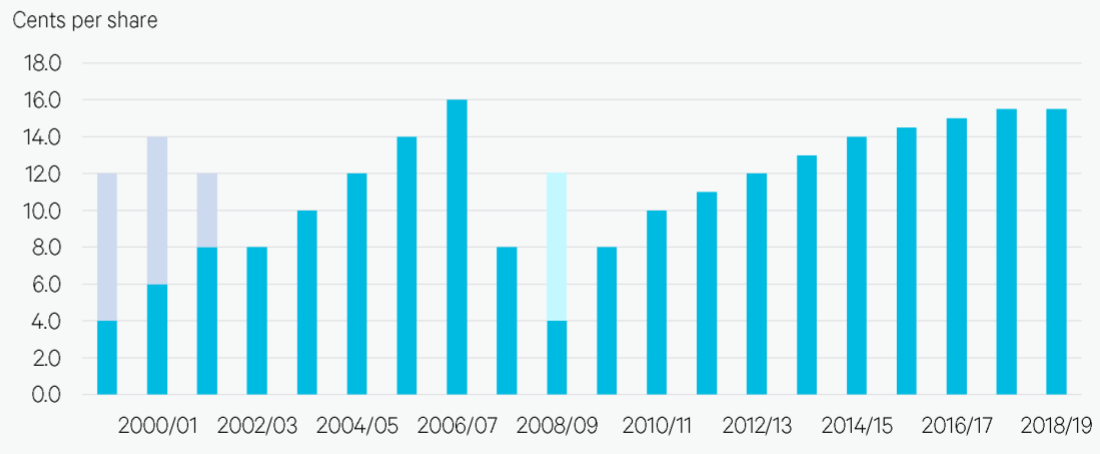
History of fully franked dividends (Source: Company Reports)
In the last three months, WAMâs stock has provided a return of 10.84% as on 26 September 2019. At market close on 27 September 2019, WAMâs stock was trading at a price of $2.265 with a market capitalisation of circa $1.61 billion. The stock is trading at a PE multiple of 108.17x with an annual dividend yield of 6.89%.
WAM Research Limited (ASX:WAX)
As at 30 August 2019, WAM Research Limited (ASX: WAX) had gross assets of $236.6 million and listed equities of $177.9 million. The company has recently declared a fully franked final dividend of 2.25 cents per share with a special dividend (100% franked) of 2.25 cents. The dividend has an ex-date of 4 October and a payment date of 18 October 2019.
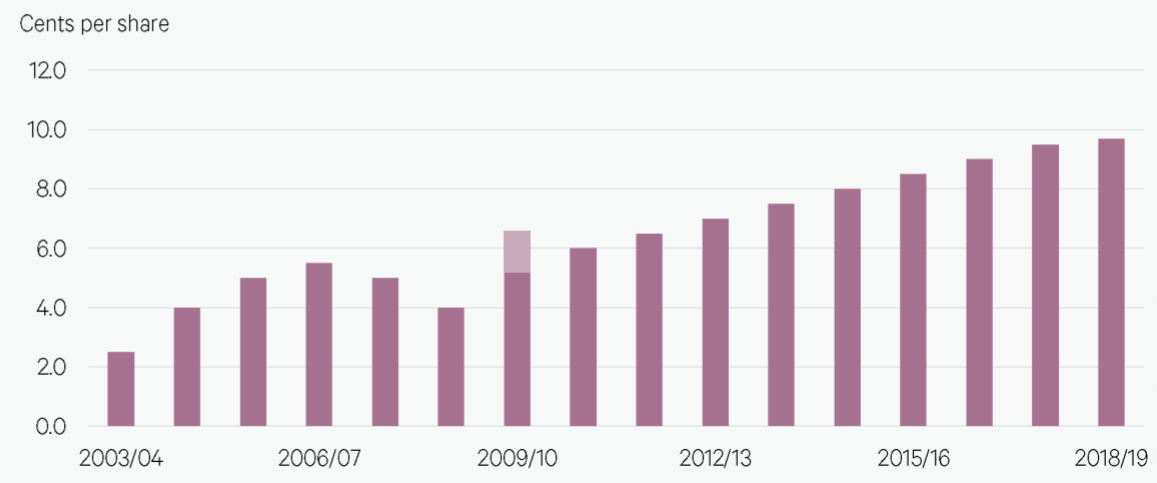
History of fully franked dividends (Source: Company Reports)
In the last three months, WAXâs stock has provided a return of 10.11% as on 26 September 2019. At market close on 27 September 2019, WAMâs stock was trading at a price of $1.465 with a market capitalisation of circa $280.63 Million. The stock is trading at a PE multiple of 172.94x with an annual dividend yield of 6.6%.
NAOS Emerging Opportunities Company Limited (ASX:NCC)
NAOS Emerging Opportunities Company Limited (ASX: NCC) is strongly progressing on its mission of providing investors with genuine long-term, concentrated exposure to Australian undervalued listed micro, small and mid-cap companies. For the financial year ending 30 June 2019, the company declared a fully franked final dividend of 3.50 cents per share, taking the full-year dividend to 7.25 cents per share, in line with last year.
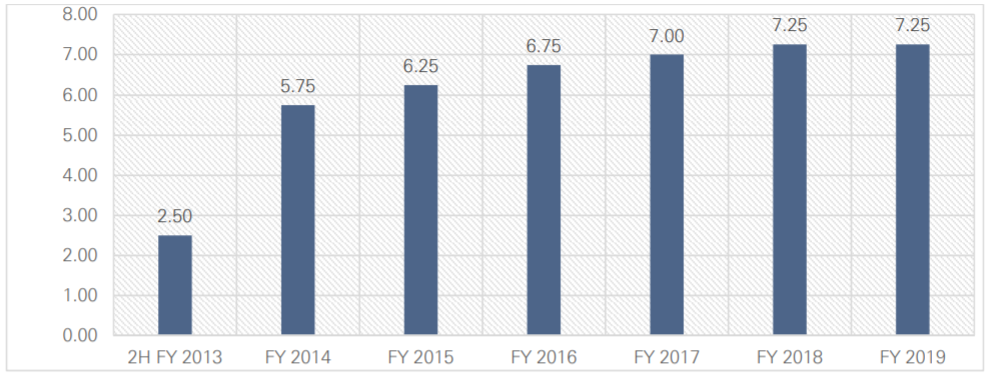
Historical Fully Franked Dividend Profile (Source: Company Reports)
In the last three months, NCCâs stock has provided a return of 17.51% as on 26 September 2019. At market close on 27 September 2019, NCCâs stock was trading at a price of $1.090 with a market capitalisation of circa $62.58 Million and an annual dividend yield of 6.97%.
Clime Capital Limited (ASX:CAM)
Fund management company, Clime Capital Limited (ASX:CAM) has a strong history of providing solid returns for its shareholders. Last month, the company declared dividend of 1.25 cents, payable on 25 October 2019.
In the last six months, CAMâs stock has provided a return of 3.93% as on 26 September 2019. At market close on 27 September 2019, CAMâs stock was trading at a price of $0.935 with a market capitalisation of circa $104.45 million. The stock is trading at PE multiple of 5.41x with an annual dividend yield of 5.41%.
Janus Henderson Group Plc (ASX:JHG)
For the quarter ending 30 June 2019, Janus Henderson Group Plc (ASX:JHG) reported net income of USD 109.4 million. Diluted earnings per share for the quarter was USD 0.56.
On 30 July 2019, the companyâs Board declared USD 0.36 per share for three months ended 30 June 2019. The dividends had a record date of 12 August 2019 and payment date of 28 August 2019.
In the last three months, JHGâs stock has provided a return of 8.40% as on 26 September 2019. At market close on 27 September 2019, JHGâs stock was trading at a price of $32.730 with an annual dividend yield of 6.32%.
Harvey Norman Holdings Limited (ASX:HVN)
Harvey Norman Holdings Limited (ASX:HVN) witnessed a growth of 8.4% in reported profit before tax (PBT) in FY19 (year ending 30 June 2019), driven by the continued dominance of its 90 Harvey Norman® company-operated retail stores overseas, the improved profitability of the property segments and the sale of equity investments during the year.
Financial Achievements of FY19
- Reported profit before tax (PBT) of $574.56m, up 8.4% on FY18
- Reported net profit after tax (NPAT) and non-controlling interests of $402.32m, up by 7.2% on last year.
- Net Assets of $3.2 billion, up by 8.8% from $2.9 billion in FY18
- Earnings per share (EPS) of 34.70 cents, up by 4.5% from 33.21 cents
- Net debt to equity ratio of 19.46%, an improvement from 25.5%
- PBT return on net assets of 18%
For FY19, the company declared a dividend of 33 cents per share (100% franked).
In the last six months, HVNâs stock has provided a return of 21.59% as on 26 September 2019. At market close on 27 September 2019, HVNâs stock was trading at a price of $4.540 with market cap of $5.33 billion. The stock is trading very near to its 52 weeks high price of $4.667. The stock is trading at a PE multiple of 13.030 with an annual dividend yield of 7.3%.
The Star Entertainment Group Limited (ASX:SGR)
Australiaâs leading integrated resort company, The Star Entertainment Group Limited (ASX:SGR) recently declared a final dividend of 10 cents per share (fully franked), taking total dividends for FY19 (year ending 30 June 2019) to 20.5 cents per share (fully franked). The total FY19 dividend is reflecting a payout ratio of 84% of FY19 normalised NPAT.
In FY19, the company earned a Net profit after tax (NPAT) of $198.0 million, which was 33.7% than the prior year.
Segment-wise Results
- Sydney Gross revenue was $1,567.8 million in FY19, down 9.7% on the pcp on pcp; EBITDA (excluding significant items) was $307.6 million, up 7.6% on the pcp; Normalised EBITDA was $367.4 million, down 5.7% on the pcp;
- Queensland (Gold Coast and Brisbane) Gross revenue was $946.2 million up 12.3% on the pcp and EBITDA (excluding significant items) was $245.2 million, up 23.5% on the pcp;
In the last three months, SGRâs stock has provided a return of 6.97% as on 26 September 2019. At market close on 27 September 2019, SGRâs stock was trading at a price of $4.340 with market cap of $3.94 billion. The stock is trading at a PE multiple of 19.910 with an annual dividend yield of 4.77%
Disclaimer
This website is a service of Kalkine Media Pty. Ltd. A.C.N. 629 651 672. The website has been prepared for informational purposes only and is not intended to be used as a complete source of information on any particular company. Kalkine Media does not in any way endorse or recommend individuals, products or services that may be discussed on this site. Our publications are NOT a solicitation or recommendation to buy, sell or hold. We are neither licensed nor qualified to provide investment advice.
