
_10_04_2024_16_38_50_427275.jpg)


Stock Market Crash:
Sudden decline (generally double-digit percentage losses) in stock prices due to any major event, leads to panic in the market, resulting in a significant loss of investors wealth. These events could be wars, change in government policies, apex bank regulations, natural disasters, etc.
Few notable market crashes are
- Panic of 1907 which occurred due to manipulation of copper stocks by the Knickerbocker company;
- Wall Street Crash of 1929 which was due to burst of a bubble of soaring stock prices of new innovative technology companies;
- October 19, 1987 (Back Monday) which was initiated with the climactic culmination of a series of market decline five days before;
- Crash of 2008-2009 primarily due to exposure to packaged subprime loans and credit default swaps issued to insure the loans and issuers. The borrowers defaulted on loan repayments and this phenomenon rapidly devolved into a global crisis resulting in a number of bank failures in USA and Europe and also led to sharp reductions in the value of stocks and commodities worldwide.
Alternative Investments:
Such events have forced almost all the investors to diversify their portfolio to mitigate any potential risk (certain and uncertain) in the future. Major investors started hedging their investments by investments into the yellow metal.
Investments in gold can be done through various ways such as
- Buying direct gold (coins, bars, artefacts, or jewellery) from the market,
- Gold ETFs (Exchange Traded Funds),
- Sovereign Gold Bonds (offered in many countries), and
- Gold and gold-mining related stocks.
Some of the important Australian gold stocks are Oceanagold Corporation (ASX:OGC), Resolute Mining Limited (ASX:RSG), St Barbara Limited (ASX:SBM), Perseus Mining Limited (ASX:PRU), etc. Let us see how the recent developments in these companies are affecting their stock prices.
Oceanagold Corporation (ASX:OGC)
Multinational Gold Producer Oceanagold Corporation (ASX:OGC) is headquartered in Melbourne, Australia. Recently, the company announced further massive drilling at the Waihi Gold Mine (Martha Underground Project). This development would add to the existing resources and increase exploration potential. An additional 8 to 10 Mn tonnes of ore with 4 to 6 g/tonne gold, is being targeted. This is in addition to 331,000 ounces of existing gold resources and potential resources of 667,000 ounces.
Key Highlights for the first half-year ended on June 30, 2019: Revenue from ordinary activities decreased by 9.2% year over year to US$365.5 Mn, mainly due to lower gold ounces sold, lower copper tons sold, and lower average price received for copper, partly offset by higher average price received for gold. Profit from ordinary activities after tax attributable to members decreased by 68.9% year over year to US$27.7 Mn. This result was attributable to lower revenue, higher operating costs, higher general & administration â indirect taxes, an unrealised loss on the fair value of undesignated gold hedges compared to an unrealised gain in 2018.
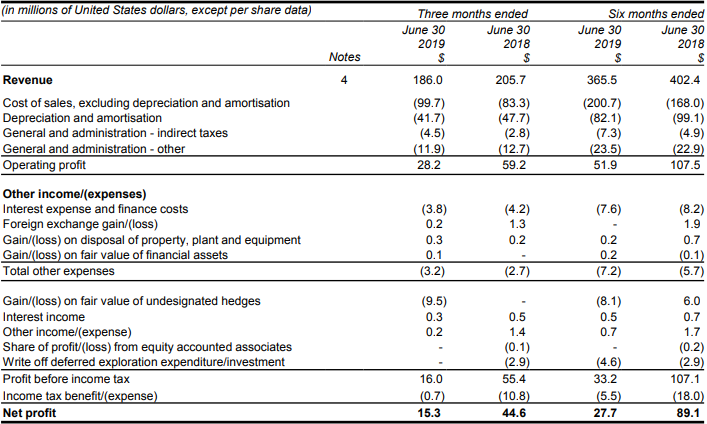
Income Statement (H1FY19 & Q2FY19) (Source: Company Reports)
On the stock price performance front
On September 27, OGC settled the dayâs trade at $4.080 down 2.158%, with the market cap of ~$2.59 Bn. Its current P/E multiple is at 26.460X. Its 52-week high and 52-week low stand at $5.280 and $3.260, respectively, with an annual average daily volume of 510,594. It has generated an absolute return of 1.46% for the last one year, -9.94% for the last six months, and -1.42% for the last three months.
Resolute Mining Limited (ASX:RSG)
Resolute Mining Limited (ASX:RSG) is involved in gold mining and commissioning of the Syama underground mine and prospecting and exploration for minerals. Recently, Van Eck Associates Corporation increased its stake in the company from 9.10% to 10.64%, effective from September 20, 2019. Earlier L1 Capital Pty Ltd became major holder in the company with a stake of 5.87%, effective from September 17, 2019.
Key Highlights of first half-year ended on June 30, 2019: Revenue from gold and silver sales for the period was reported at $324 Mn, as compared to $243 Mn in H1FY18. Earnings before interest, tax, depreciation and amortisation for the period was reported at $78 Mn, as compared to $29 Mn in the previous corresponding period. Gross profit from operations for the period was reported at $69 Mn, as compared to $39 Mn in the previous corresponding period. Net profit after tax for the period was reported at $39 Mn, as compared to $39 Mn in the previous corresponding period. Gold production for the period stood at 176,237 oz, as compared to 141,437 oz in H1FY18. Average gold price received for the period was reported at $1,800 per oz, as compared to $1,723 per oz in the previous corresponding period.
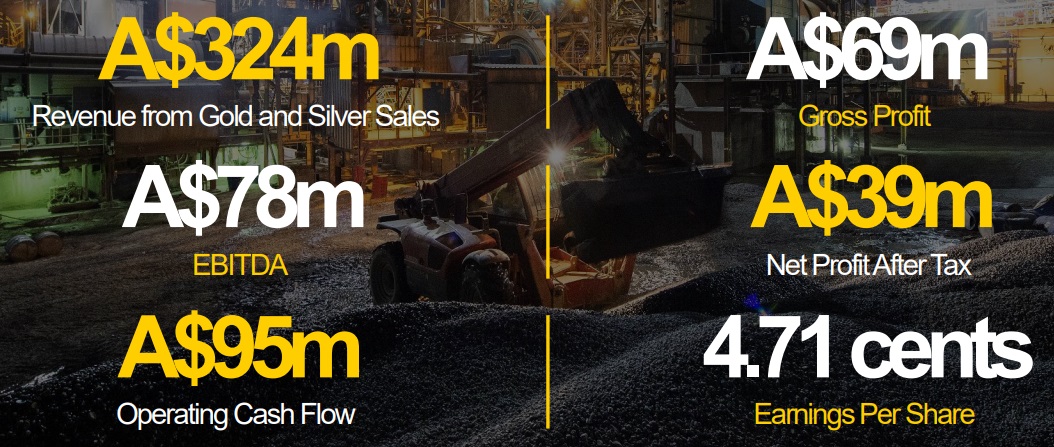
H1FY19 Key Financial Metrics (Source: Company Reports)
On the stock information front
On September 27, RSG settled the dayâs trade at $1.465 down 2.333%, with the market cap of ~$1.35 Bn. Its current PE multiple is at 35.130x. Its 52-week high and 52-week low stand at $2.120 and $0.910, respectively, with an annual average daily volume of 12,149,583. It has generated an absolute return of 39.53% for the last one year, 21.95% for the last six months, and -14.77% for the last one month.
St Barbara Limited (ASX:SBM)
St Barbara Limited (ASX:SBM) is involved in mineral exploration and development. It also has mines and sells gold. Recently, Norges Bank ceased to be substantial holder in the company, effective from September 25, 2019. In another update, two of companyâs director Ms Kerry Jo-anne Gleeson and Mr Timothy Carl Netscher, acquired 158 fully paid ordinary shares and 897 fully paid ordinary shares, respectively, at $2.9854 per fully paid ordinary share, effective from September 25, 2019.
Key Highlights for the financial year ended June 30, 2019 (Consolidated financials): Total revenue decreased from $679,204,000 in 2018 to $650,321,000 in 2019, mainly due to the reduced production of the group, partially offset by the higher average gold price of $1,762 per ounce, as compared to $1,691 per ounce in the year-ago period. Mine operating costs in 2019 were $299,075,000 compared with $275,695,000 in the prior year, mainly due to Simberi as a result of higher processing costs, the release of costs associated with gold in safe inventory and the impact of a weaker AUD/USD exchange rate on conversion of Simberi USD denominated results. Interest revenue for the period was reported at $10,073,000 in 2019, as compared to $5,283,000 in the previous year. Other income for the period was reported at $115,000, as compared to $2,053,000 in 2018, representing minor asset sales. Total exploration expenditure for the period amounted to $31,401,000, as compared to $14,169,000 in 2018. Current assets for the period increased to $971,469,000, as compared to $420,781,000 in 2018, due to the significant increase in cash and cash equivalents. Cash Balance at the end of the period was reported at $880,199,000, as compared to $226,443,000 at the end of June 30, 2018.
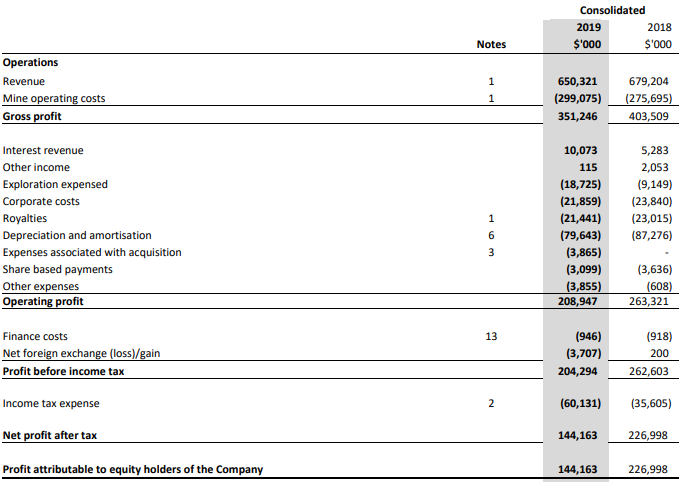
FY19 Income Statement (Source: Company Reports)
On the stock information front
On September 27, SBM settled the dayâs trade at $2.930 down 2.98%, with the market cap of ~$2.1 Bn. Its current PE multiple is at 11.190x. Its 52-week high and 52-week low stand at $5.152 and $2.480, respectively, with an annual average daily volume of 6,803,967. It has generated an absolute return of -8.81% for the last one year, -11.40% for the last six months, and -0.66% for the last three months.
Perseus Mining Limited (ASX:PRU)
Perseus Mining Limited (ASX:PRU) is involved in gold production, mineral exploration and gold project development in the Republic of Ghana and the Republic of Côte dâIvoire (âCôte dâIvoireâ), both of which are located in West Africa. Recently, the company issued 9,858,700 performance rights; each performance right will convert to an ordinary share upon satisfaction of vesting criteria, subject to the terms and conditions of the Companyâs Performance Rights Plan approved by shareholders in November 2017.
Key Highlights for the financial year ended June 30, 2019 (Consolidated Financials): Company produced a total of 271,824 ounces of gold in the period, which is a 6% more than in the previous year. The weighted average all-in site costs (AISC) averaged US$960 per ounce of gold produced, 8% lower than the previous year. EBITDA from operations for the period was reported at $164.1 Mn, which is a 19% increase over previous year. Net profit after tax for the period was reported at $7.6 Mn versus a net loss after tax of $24.9 Mn in the prior year. The improvement can be attributed to 19% increase in operating EBITDA which resulted from 35% increase in revenues. Revenue increase was a result of 3% higher average gold sales price and 28% higher gold sales. This was made possible by full year of commercial production at Sissingué.
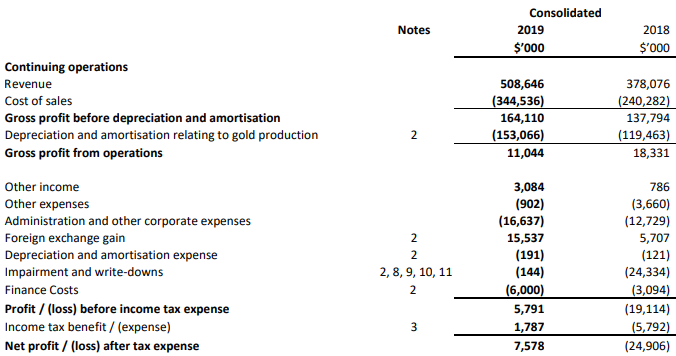
FY19 Income Statement (Source: Company Reports)
On the stock information front
On September 27, PRU settled the dayâs trade at $0.730 down 0.68%, with the market cap of ~$858.47 Mn. Its current PE multiple is at 111.360x. Its 52- week high and 52-week low stand at $0.895 and $0.332, respectively, with an annual average daily volume of 8,092,845. It has generated an absolute return of 101.37% for the last one year, 45.54% for the last six months, and 27.83% for the last three months.
Disclaimer
This website is a service of Kalkine Media Pty. Ltd. A.C.N. 629 651 672. The website has been prepared for informational purposes only and is not intended to be used as a complete source of information on any particular company. Kalkine Media does not in any way endorse or recommend individuals, products or services that may be discussed on this site. Our publications are NOT a solicitation or recommendation to buy, sell or hold. We are neither licensed nor qualified to provide investment advice.
