


Gold prices are in upside momentum over central banks demand push and higher ETFs inflow, which in turn, is supporting the gold prices in the international market. The market participants are also favouring gold prices to hedge against the discrepancies between the stock and fixed income instruments. While the stock market is soaring globally, the bond yields are nose-diving, which is further aiding the bond prices.
The market participants are concerned over the discrepancies and are hedging against the change in stock and bond correlation with the safe haven, which in turn, is pushing the gold demand.
Another factor, which is fanning the gold prices is the high probability of the United States Federal Reserve to cut the interest rate by 50 basis points. In the recent addresses to the media houses, the United States FED chair Jerome Powell mentioned that the FED would do anything to restore the global economic conditions, which in turn, is adding to the high probability of a rate cut.
Over the high possibilities of a rate cut, the dollar prices are facing pressure, which is further adding to the gold cushion, and the global cues are nudging the investors towards gold.
However, many investors are taking alternative routes to take the gold exposure to avoid the high volatility in the commodity market, which is further showing a ripple effect in the gold miners stock price. Over the recent gold rush, many popular ASX-listed names have performed well in recent months.
ASX-listed Gold Miners:
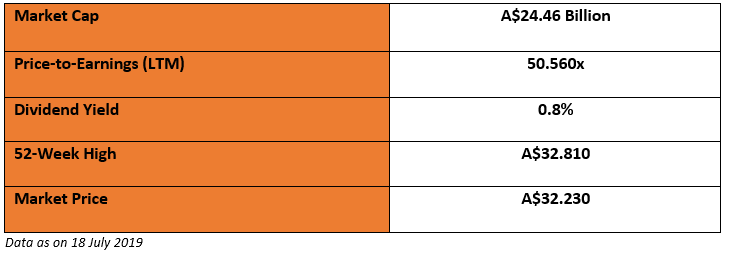
Newcrest Mining Limited (ASX: NCM)
Stock Vs Benchmark:
NCM & S&P/ASX 200:
The stock has outperformed the S&P/ASX index on a YTD basis, the total return and absolute price change return of NCM outperformed the total returns and absolute price change return of the S&P/ASX 200.
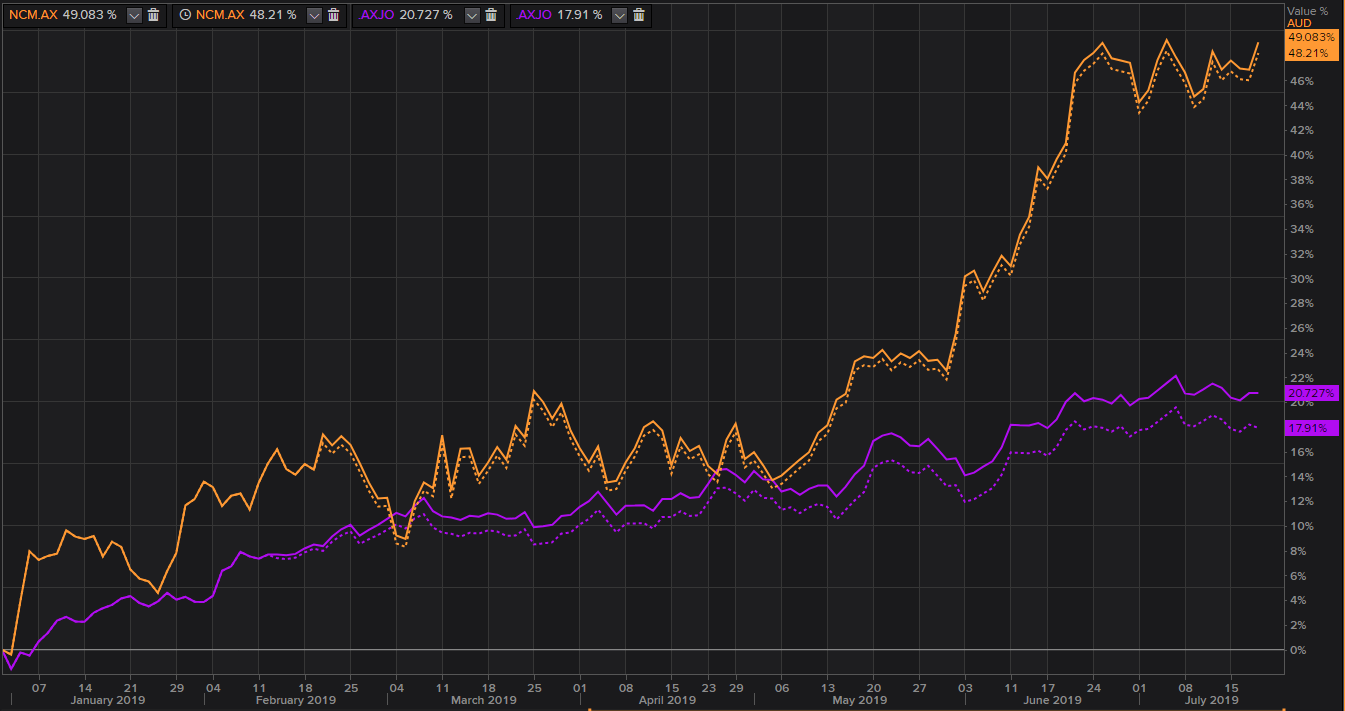
NCM and S&P/ASX 200 Index returns (YTD) (Source: Thomson Reuters)
On the chart shown above, the dotted line represents the absolute Price Change return, while the thick line represents total returns. NCM delivered a total return of 49.083 per cent on a YTD basis, while NCM delivered an absolute price change return of 48.21 per cent. Both the returns outperform the index returns of 20.727 per cent and 17.91 per cent on total and absolute returns respectively.
The recent gold rush supported the share prices of the company, and the stock delivered outperforming returns over the past three months (18th April 2019 â 18th June 2019) against the S&P/ASX 200 Index.
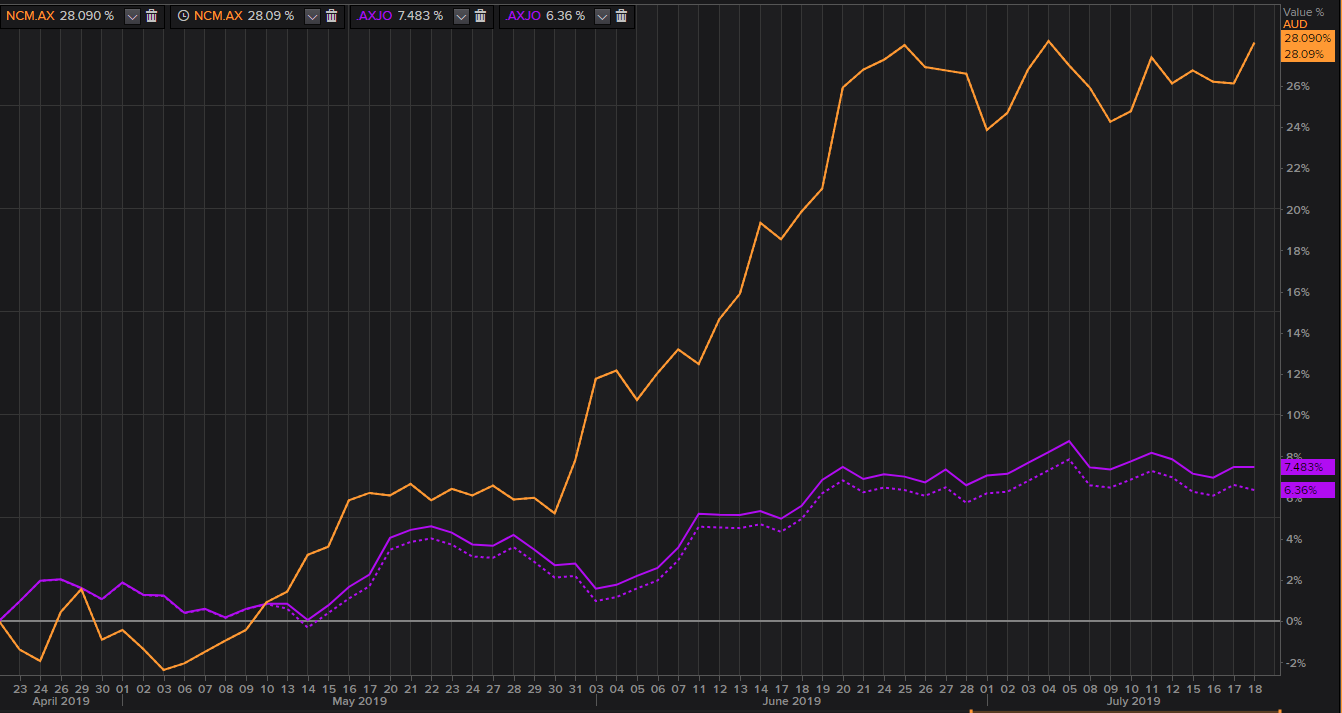
NCM and S&P/ASX 200 Index returns (3-months) (Source: Thomson Reuters)
Over the past three months, NCM delivered a total return of 28.090, against the three months return (both total and absolute) from the S&P/ASX 200 Index returns, which stood at 7.483 per cent (total) and 6.36 per cent (absolute price change).
NCM & S&P Commodity Producers Gold Index NTR:
While compared to the S&P Commodity Producers Gold Index net total returns, the stock of the company delivered superior returns on a YTD basis.
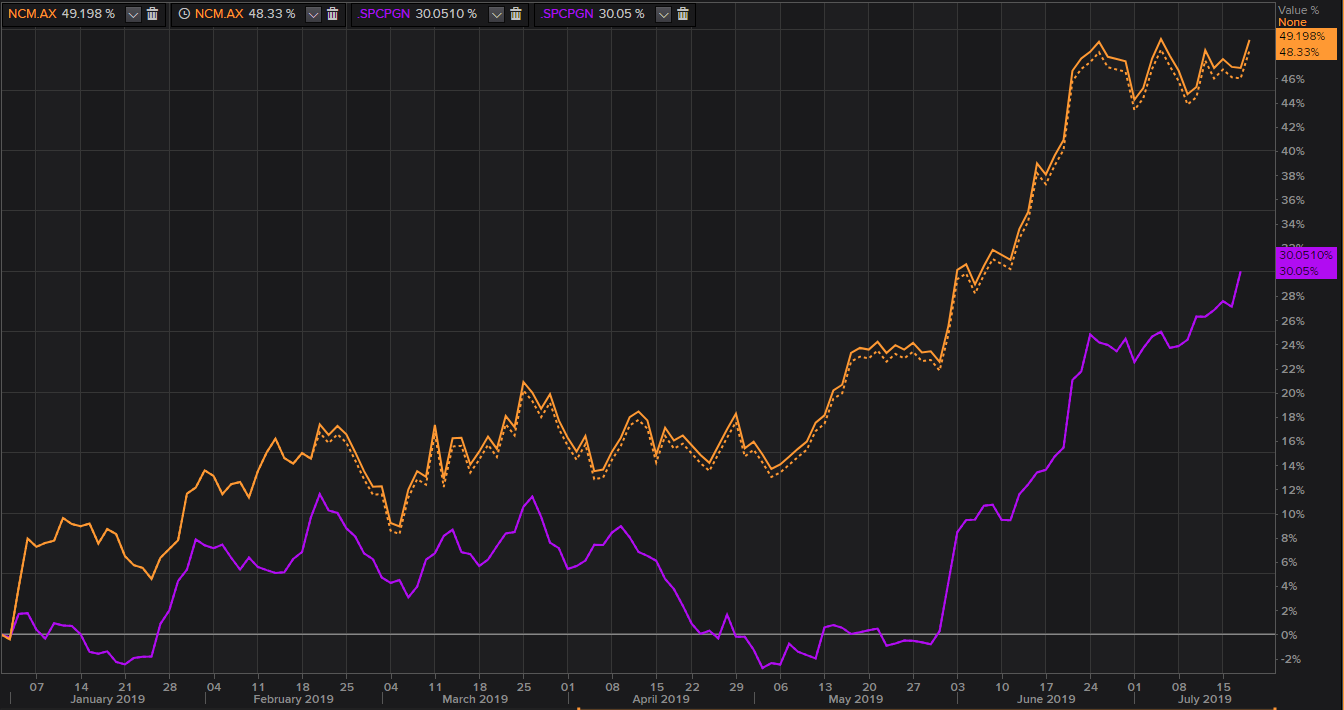
NCM and S&P Commodity Gold Producers Index NTR (YTD) (Source: Thomson Reuters)
The share prices of the company also outperformed the net total returns from the S&P Commodity Producers Gold Index over the past three months (18th April 2019 â 18th June 2019).
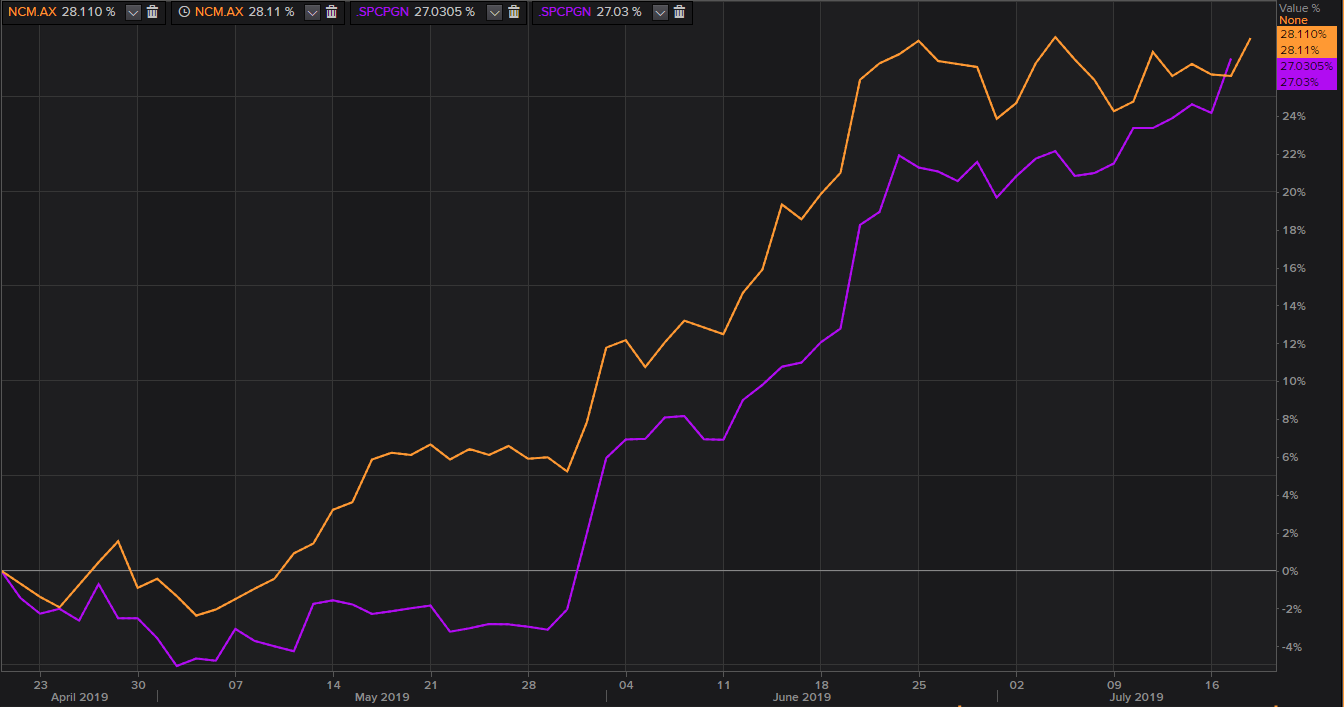
NCM and S&P Commodity Gold Producers Index NTR (3-months) (Source: Thomson Reuters)
NCM on Charts:
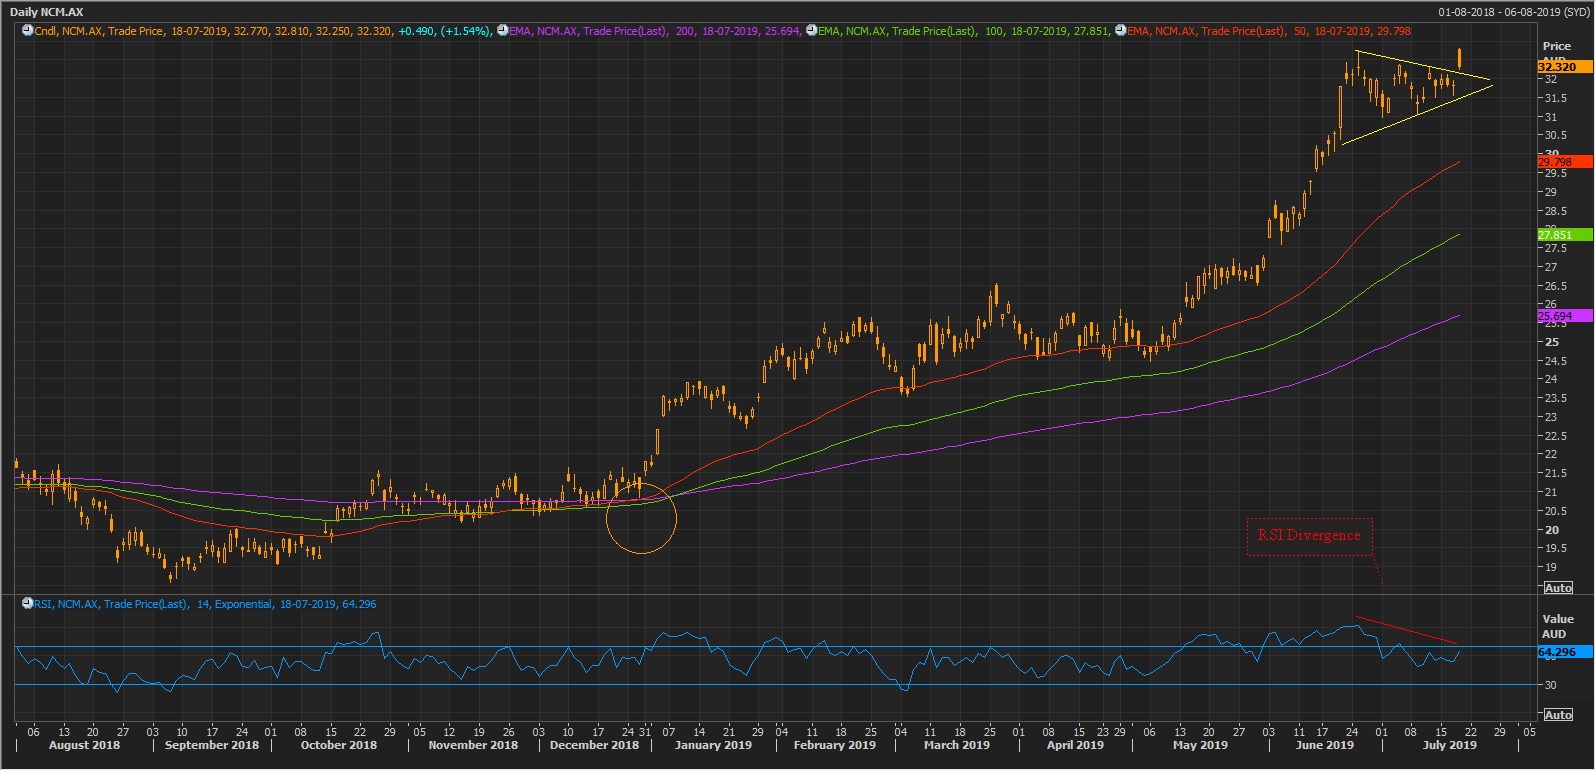
NCM Daily Chart (Source: Thomson Reuters)
On a daily chart, the stock just breached the symmetrical triangle (yellow triangle) formation and rose. The upper line of the symmetrical triangle should act as a support for the share prices. The stock is trading above the trio of 50,100, and 200-days exponential moving average, which are at A$29.793, A$27.851, and A$25.694 respectively.
On the technical indicator front, the 14-days RSI is showing a bearish divergence, while the share prices are moving in an uptrend, the 14-days period RSI is moving in a downtrend, which in turn, could exert some pressure on the share prices over the short-term.
Evolution Mining Limited (ASX: EVN)
Stock Vs Benchmark:
EVN & S&P/ASX 200:
The stock has outperformed the S&P/ASX index on a YTD basis, the total return and absolute price change return of EVN outperformed the total returns and absolute price change return of the S&P/ASX 200.
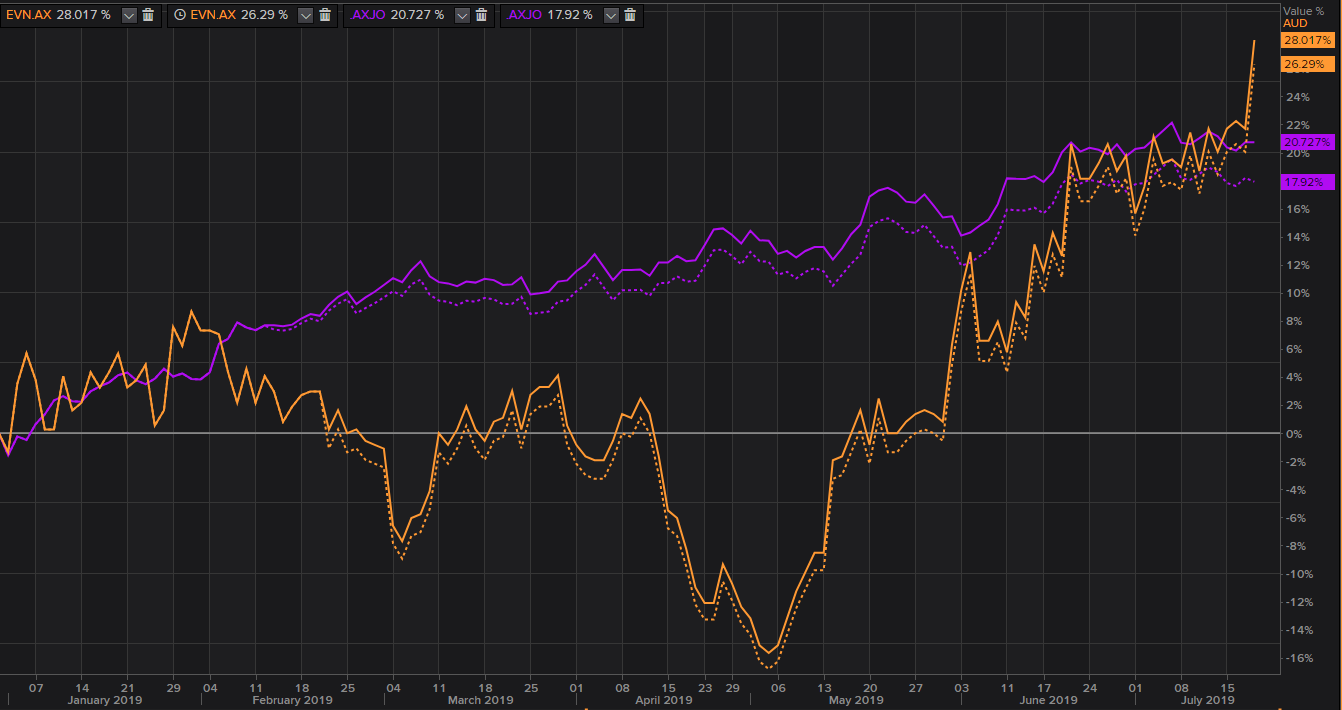
EVN and S&P/ASX 200 Index returns (YTD) (Source: Thomson Reuters)
EVN delivered a total return of 28.017 per cent on a YTD basis, while it delivered an absolute price change return of 26.29 per cent. Both the returns outperform the index returns.
EVN shares delivered outperforming returns over the past three months (18th April 2019 â 18th July 2019) against the S&P/ASX 200 Index supported by the gold upside momentum.
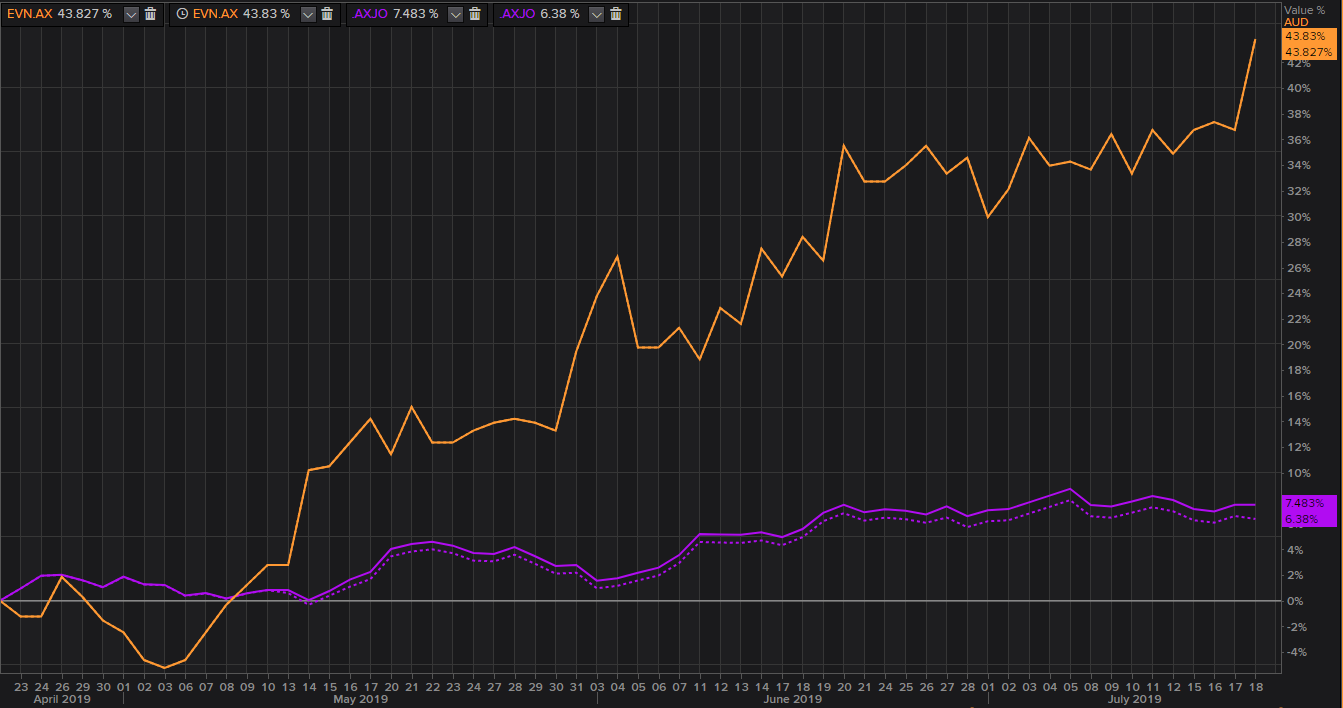
EVN and S&P/ASX 200 Index returns (3-months) (Source: Thomson Reuters)
EVN & S&P Commodity Producers Gold Index NTR:
EVN returns slightly underperformed the net total returns from the S&P Commodity Producer Gold Index on a YTD basis as seen on the chart below.
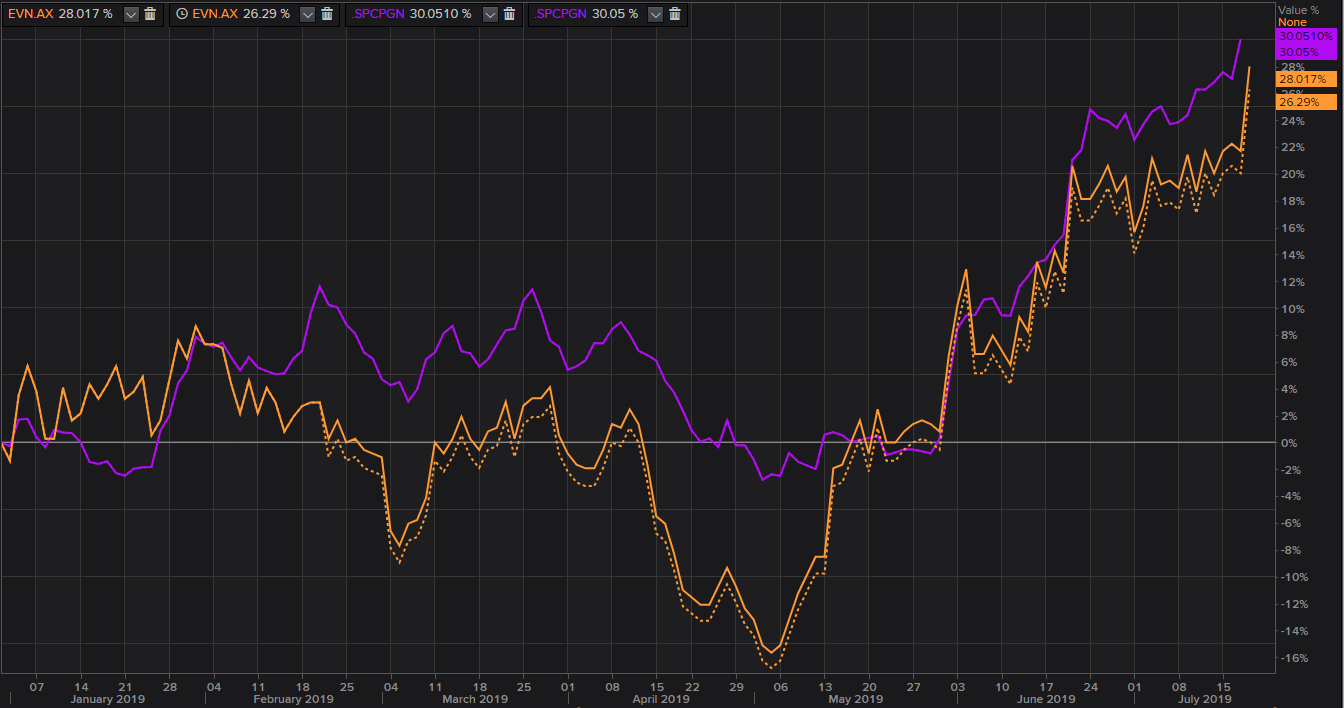
EVN and S&P Commodity Gold Producers Index NTR (YTD) (Source: Thomson Reuters)
However, the recent gold rush supported the stock prices and the stock rose from the level of A$3.040 (low in May 2019) to the present high of A$4.670 (as on 18th July 2019 2:55 PM AEST). Due to the upside the stock outperformed the net total returns from the S&P Commodity Producers Gold Index over the past three months (18th April 2019 â 18th July 2019).
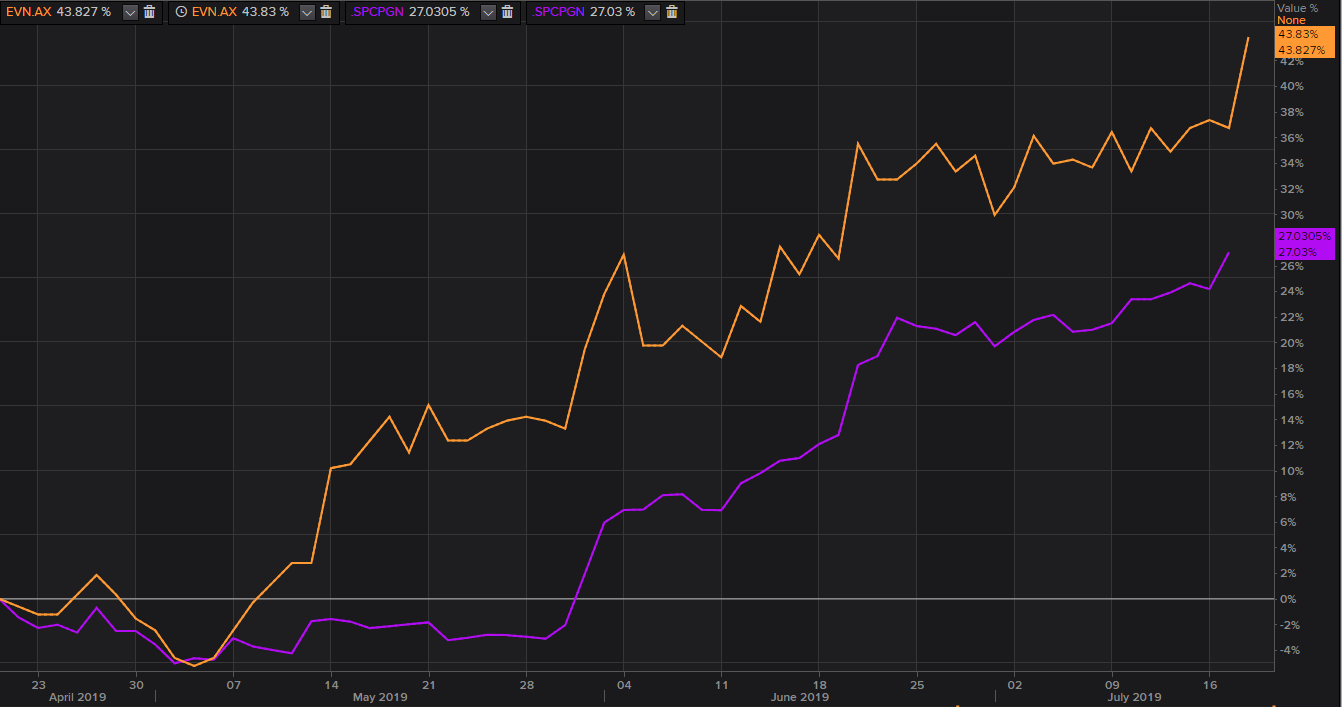
EVN and S&P Commodity Gold Producers Index NTR (3-months) (Source: Thomson Reuters)
EVN on Charts:
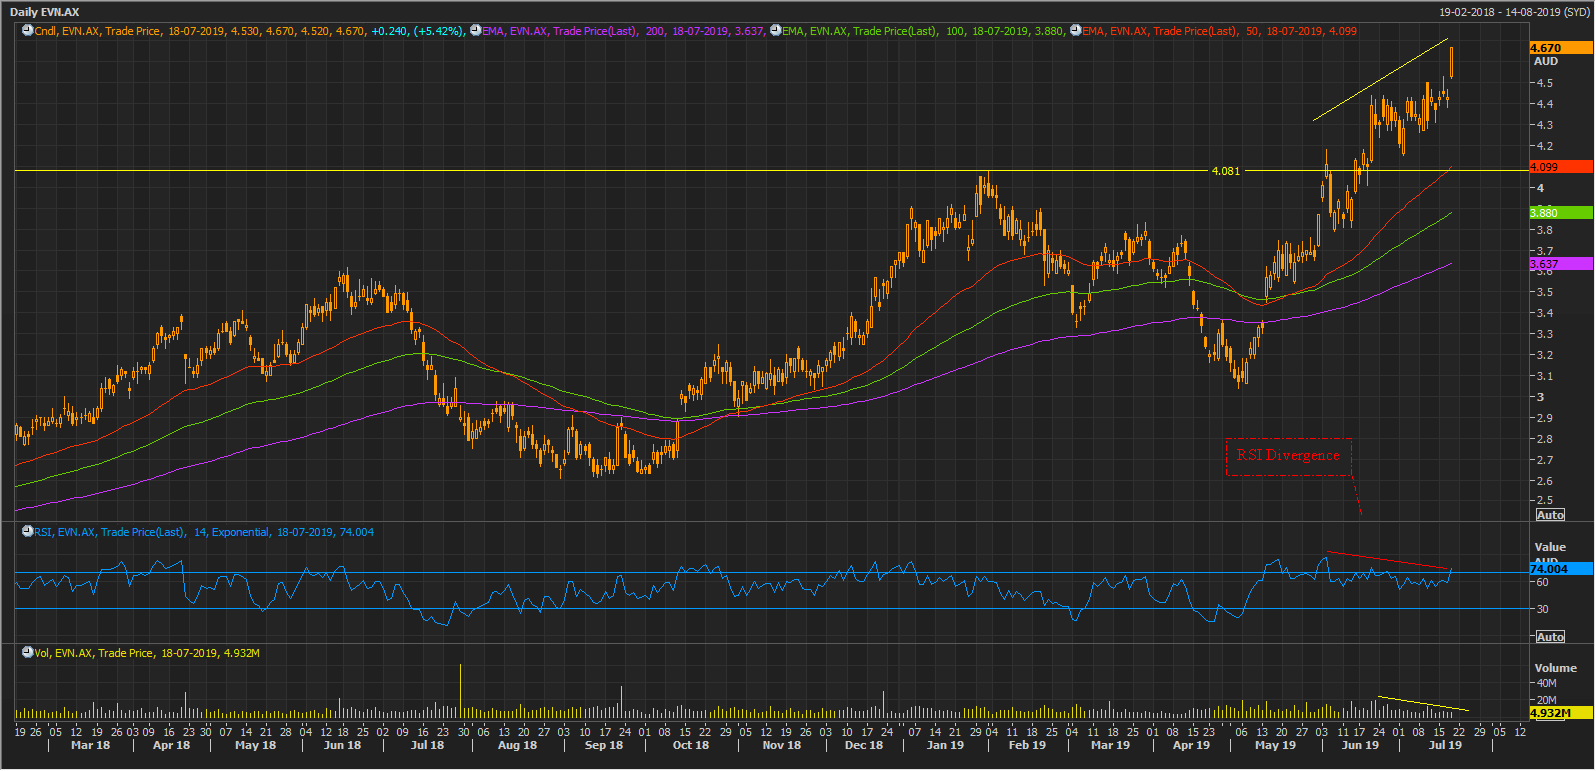
EVN Daily Chart (Source: Thomson Reuters)
On the daily chart, the stock recently crossed its resistance level of A$4.081, which could now act as a support for the share prices. The share prices are trading above the 50,100, and 200-days exponential moving averages, and the 50-days EMA, which is at A$4.099 could act as a primary support for the share prices.
On the technical indicator front, the 14-days RSI is witnessing a bearish divergence with declining volumes, which in turn, suggests that the bull strength is running out.
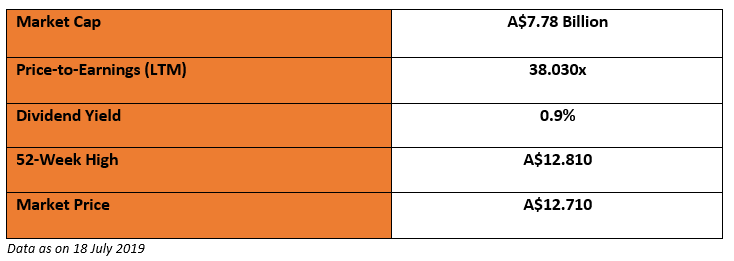
Northern Star Resources Limited (ASX: NST)
Stock Vs Benchmark:
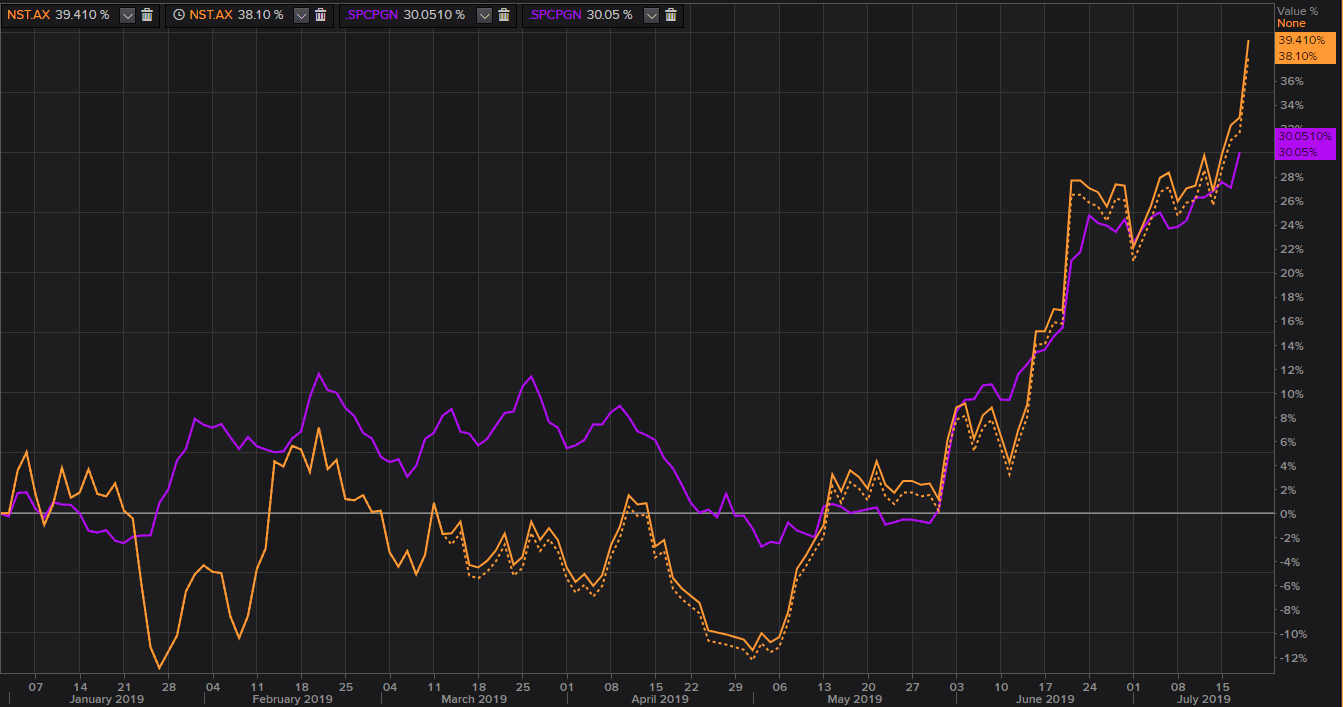
NST & S&P/ASX 200:
The Stock has outperformed the S&P/ASX index on a YTD basis, the total return and absolute price change return of NST outperformed the total returns and absolute price change return of the S&P/ASX 200.
NST and S&P/ASX 200 Index returns (YTD) (Source: Thomson Reuters)
NST delivered a total return of 39.410 per cent on a YTD basis, while it delivered an absolute price change return of 38.10 per cent. Both the returns outperform the index returns.
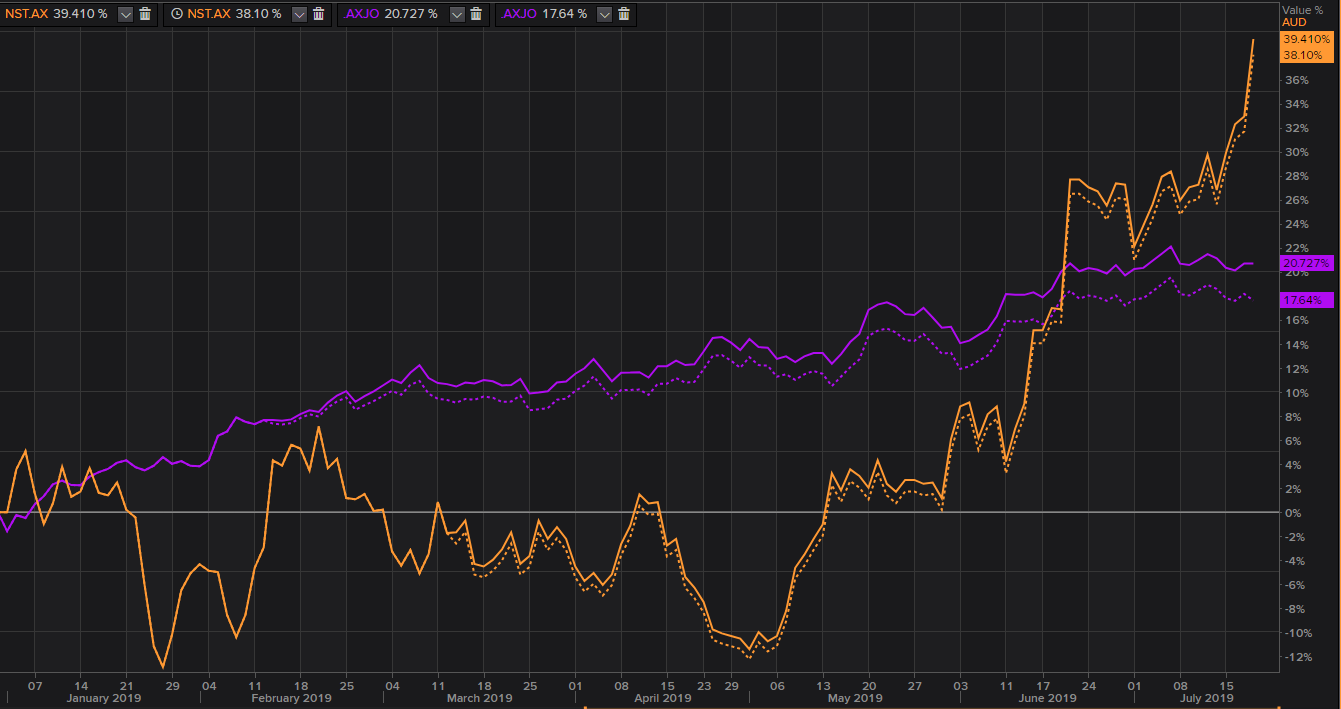
NST delivered outperforming returns over the past three months (18th April 2019 â 18th July 2019) against the S&P/ASX 200 Index.
NST and S&P/ASX 200 Index returns (3-months) (Source: Thomson Reuters)
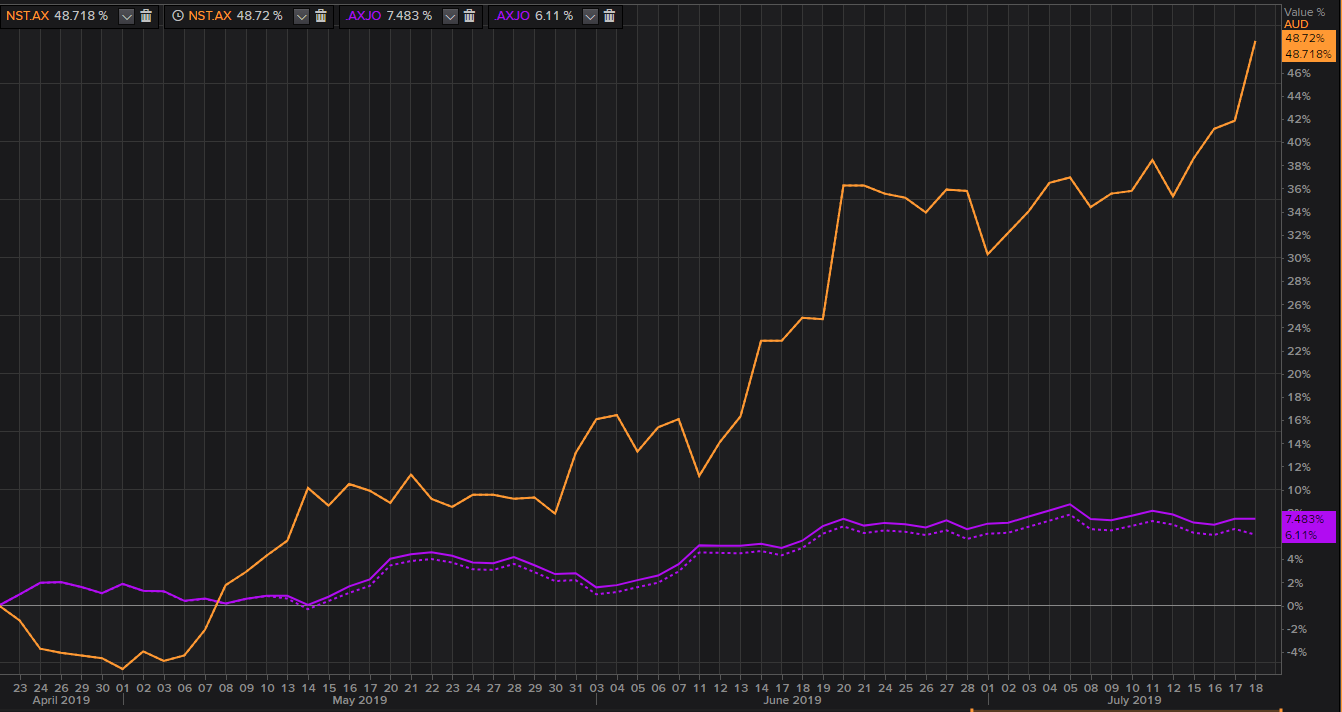
NST & S&P Commodity Producers Gold Index NTR:
While compared to the S&P Commodity Producers Gold Index net total returns, the stock of the company delivered superior returns on a YTD basis.
NST and S&P Commodity Gold Producers Index NTR (YTD) (Source: Thomson Reuters)
The total returns from NST on a YTD basis stood at 39.410 per cent; while the absolute price change return on a YTD basis stood at 38.10 per cent. Both the returns delivered by the company outperformed the net total returns from the S&P Commodity Producers Gold Index.
Not just on a YTD basis, the gold rush over the last three months shinned the companyâs stock, and the stock delivered substantial results over the S&P Commodity Producers Gold Index NTR in the past three months.
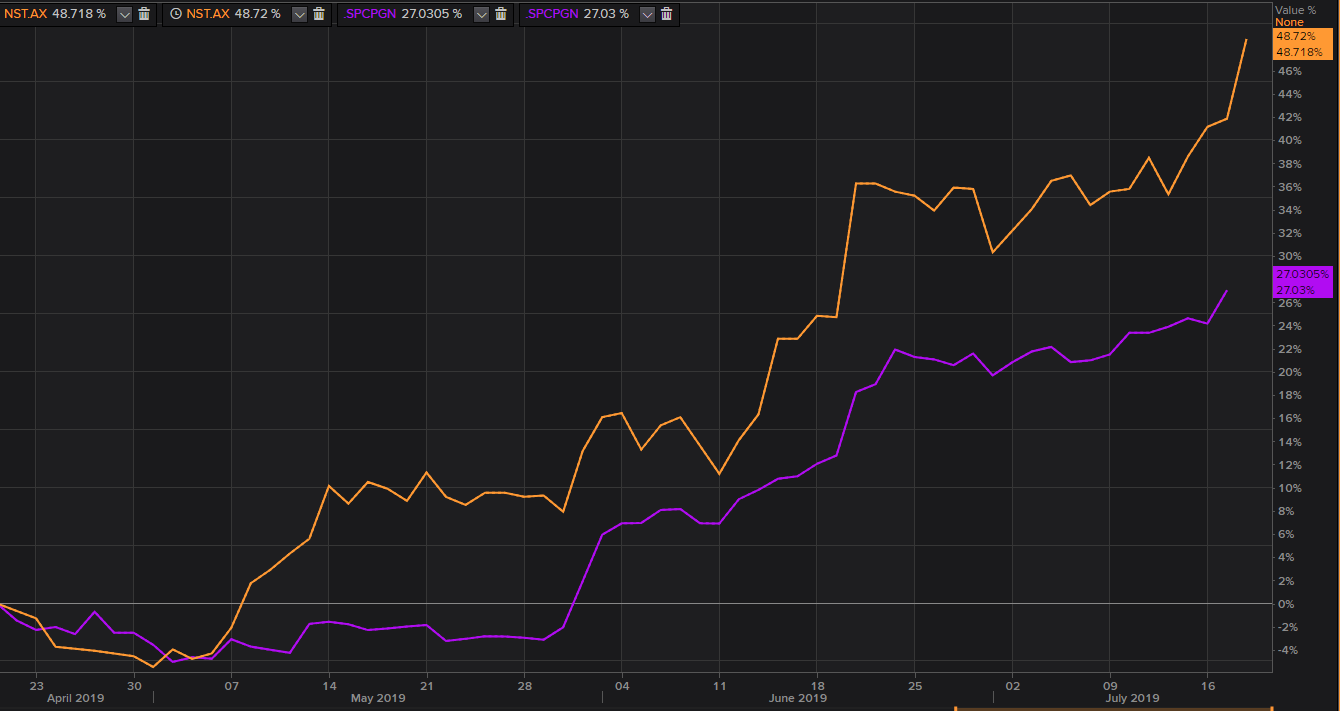
NST and S&P Commodity Gold Producers Index NTR (3-months) (Source: Thomson Reuters)
NST on Charts:
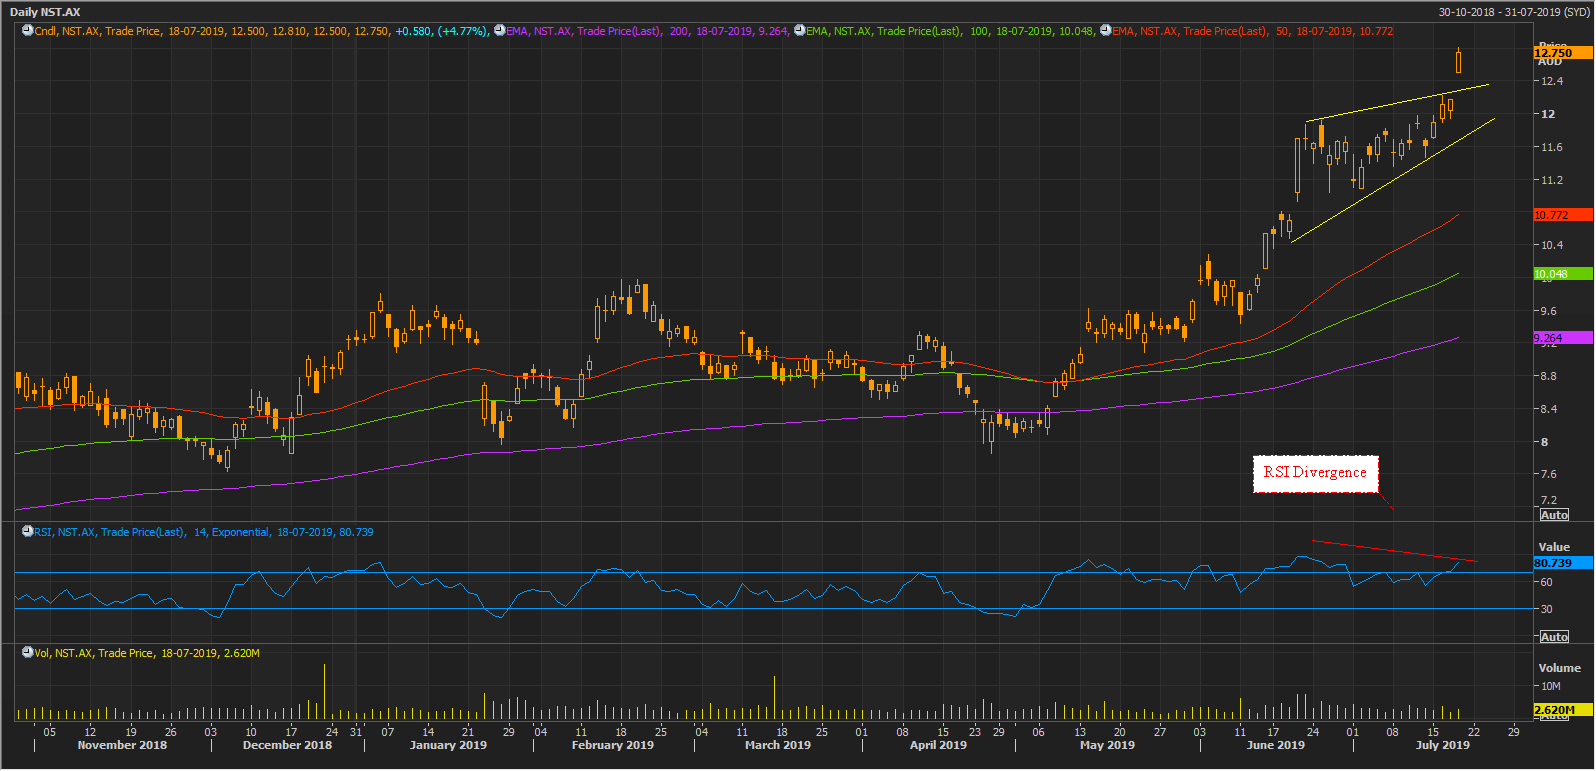
NST Daily Chart (Source: Thomson Reuters)
On a daily chart, the share prices are moving in an uptrend, and recently breached the upward sloping channel line. However, the 14-days RSI is showing a bearish divergence with declining volume, which suggest a possible short-term correction; before, the prices could resume the original uptrend.
The upper line of the channel should act as the primary support, and the stock is trading above the trio of 50,100 and 200-days exponential moving average, which could extend their support to the share prices if the stock witnesses a short-term price correction.
Return Profile with Gold:
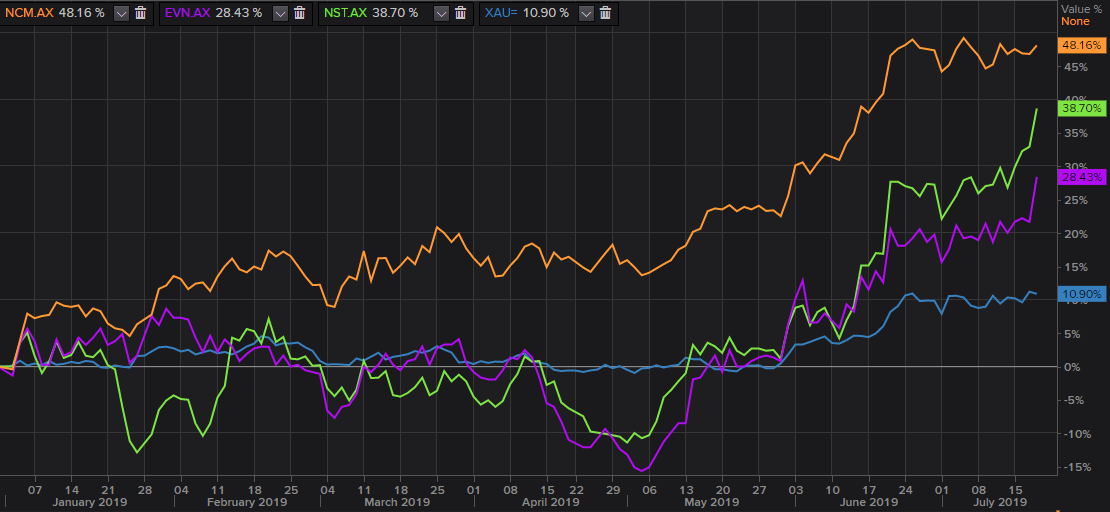
NCM, EVN, NST, XAU total returns (YTD) (Source: Thomson Reuters)
The stock returns from NCM, EVN and NST outperformed the return from gold. Out of all, NCM delivered the highest total returns on a YTD basis. However, over the last three months NST outperformed all as observed in the below chart.
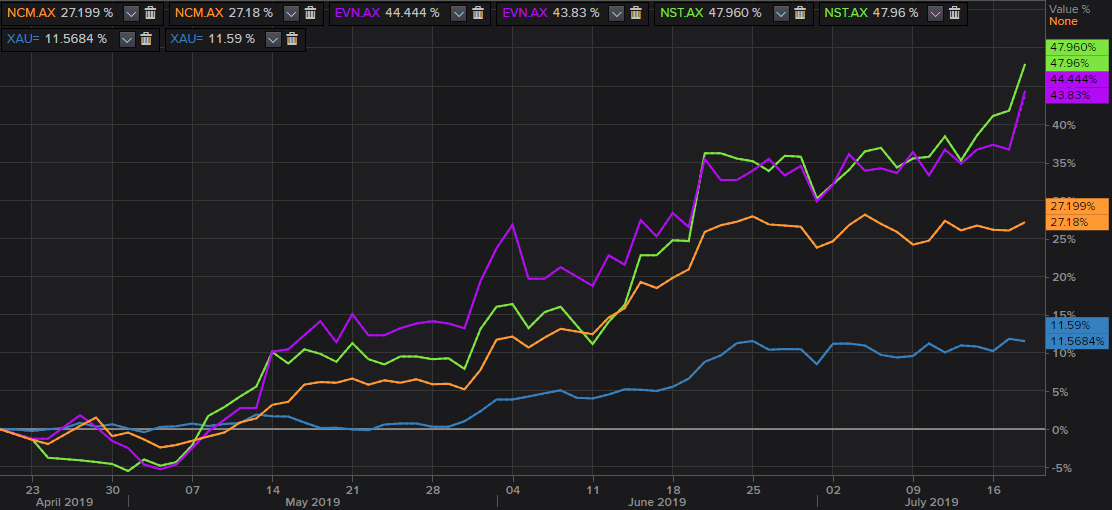
NCM, EVN, NST, XAU total returns(3-months) (Source: Thomson Reuters)
Disclaimer
This website is a service of Kalkine Media Pty. Ltd. A.C.N. 629 651 672. The website has been prepared for informational purposes only and is not intended to be used as a complete source of information on any particular company. Kalkine Media does not in any way endorse or recommend individuals, products or services that may be discussed on this site. Our publications are NOT a solicitation or recommendation to buy, sell or hold. We are neither licensed nor qualified to provide investment advice.
