


The ASX and NZX are the two core stock exchanges of the ANZ region. Interestingly, there are companies who choose to be listed on both the platforms, most likely to generate higher yields. Typically, the NZ based firms choose to be listed on ASX (without the need to meet high financial thresholds applicable to other ASX Foreign Exempt Listings) to expand their reach-out to capital and take benefit of liquidity provided on ASX. They are referred to as the ASX Foreign Exempt Listing.
Before we understand the comparative scenario of these stock exchanges, let us look at them separately:
Australian Securities Exchange- ASX:
A vertically integrated and multi-asset class exchange group, ASX Group is the exchange group which operates Asiaâs largest interest rate derivative market. It is also amongst the worldâs top ten listed exchange groups, in terms of market cap.
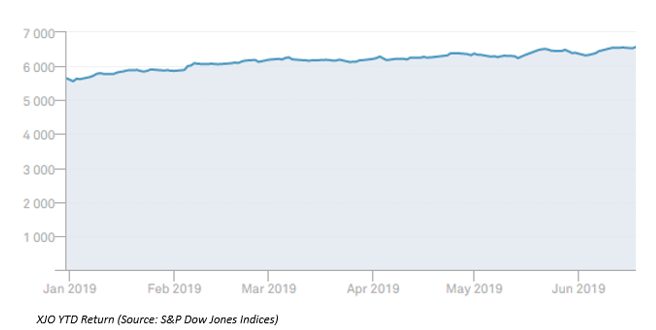
The benchmark index for Australian equity market, S&P/ASX 200 (XJO) reflects performance of 200 largest stocks listed on ASX, by float-adjusted market capitalization. Despite global macro-concerns and domestic economic volatility, S&P/ASX 200 has performed reasonably well at premium levels this year.
New Zealand Stock Exchange- NZX:
New Zealandâs leading stock exchange, operating debt, equity, energy markets and derivatives, has taken a step ahead to own Smartshares, to enable good investor connectivity along with KiwiSaver provider SuperLife. As recorded on 17th April 2019, the exchange had 164 listed securities with a combined market cap of NZ$147.8 billion.
ASX versus NZX
On 17th June 2019, the Aussie shares ended lower; the S&P/ASX 200 index went down by 0.35% to close at 6,530.90. Today, 18th June 2019, the index closed at 6570, up 0.60%.
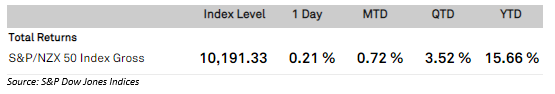
The S&P/NZX 50 index settled at the lower level yesterday, falling by 0.6% to close at 10,170.260. On the day of writing, 18th June 2019, the S&P/NZX 50 Index declined by 0.21%, settling at 10,191.33.
Let us look at three stocks having exposure to both the equity markets.
Chorus Limited
New Zealandâs largest telecommunications infrastructure company, Chorus Limited (ASX:CNU) is listed on both ASX and NZX. The dual listing has been since 2011, and a market trend confirms that in this tenure, the companyâs stock has shown a similar trend, i.e. the stock has ideally moved in the same style at both the exchanges.
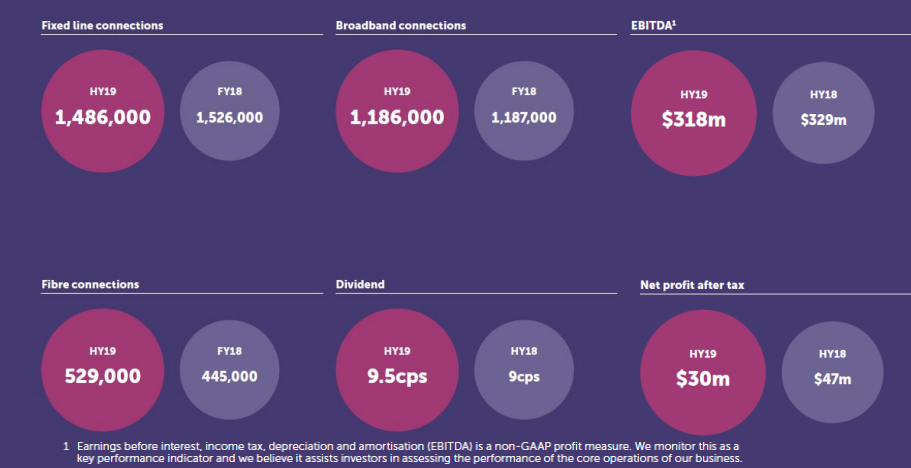
Financial performance: As per the companyâs half-year results for the period ending 31st December 2018, the NPAT was $30 million, and the EBITDA was $318 million.
Financial Performance (Source: Companyâs report)
Share price information: On 18th June 2019, the stock settled the dayâs trade at A$5.540, up by 1.28% on ASX with a market cap of A$2.4 billion. On NZ stock exchange, CNU closed at NZD5.85, up by 1.30%.
A2 Milk Company Limited
Another company listed on both exchanges is the A2 Milk Company Limited (ASX:A2M) which was founded in New Zealand and presently has dairy and infant formula products and trading activities across ANZ, the US, the UK, China and other emerging Asia markets.
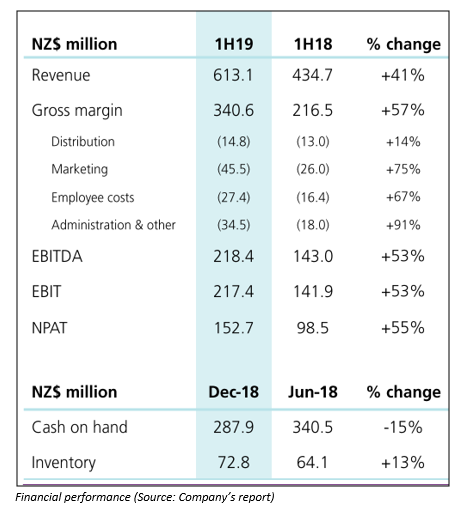
The company presented at the Macquarie Australia conference 2019 on 1st May and reported its 1H19 revenue to be up by 41% at $613 million.
Share price information: On 18th June 2019, A2M settled the dayâs trade at A$13.410, down by 3.25% on ASX with a market cap of A$10.19 billion. On NZ stock exchange, the stock (NZE: ATM) closed at NZD14.24, down by 2.73%.
Xero Limited
An online accounting software, typically for small businesses, Xero Limited (ASX: XRO) was delisted from the NZX in 2018. Exceptionally and as a unique case, the companyâs shareholders on NZX were automatically provided with equivalent shares on the ASX.
New Listing impact: As announced in the companyâs Annual report for the year ending 31st December 2018, Chairman Graham Smith commented that the benefits XRO expected from consolidating its listing on the ASX had been realised. For the first time, the business had received positive free cash flow (excluding the funds used for acquisitions). Moreover, the Liquidity in the companyâs stock had more than doubled ever since it was solely listed on ASX. There had been a noticeable higher investor and analyst interest with new investors on board.
The investorsâ assurance with XRO was depicted when the company issued $300 million convertible notes and completed the same in October 2018. As notified, the total number of subscribers at the end of the period were up by 432,000 on Y-O-Y basis and numbered at 1,818,000. Their lifetime value was up by 36% on a Y-O-Y basis and amounted to $4.4 billion. It should also be noted that this was the first time when the companyâs international market added more subscribers than the foundation markets of the ANZ belt.
Financial performance: Looking at the companyâs financial performance, there was an operating revenue growth of 36% and the positive free cash flow was recorded at $6.5 million, although Net Losses increased by 9%.
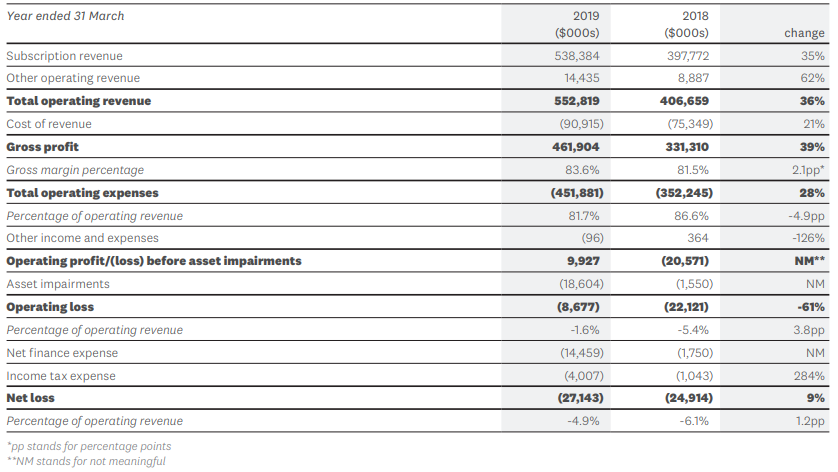
Financial Summary (Source: Companyâs report)
Share price information: On 18th June 2019, XRO settled the dayâs trade at A$60.340, up by 2.115% on ASX with a market cap of A$8.33 billion.
Disclaimer
This website is a service of Kalkine Media Pty. Ltd. A.C.N. 629 651 672. The website has been prepared for informational purposes only and is not intended to be used as a complete source of information on any particular company. Kalkine Media does not in any way endorse or recommend individuals, products or services that may be discussed on this site. Our publications are NOT a solicitation or recommendation to buy, sell or hold. We are neither licensed nor qualified to provide investment advice.
