


Gold prices backed by the central banks and global gold-backed ETFs demand coupled with global uncertainties have delivered a shiny performance, and despite stagnant or lower production, the gold miners on the Australian Securities Exchange have encashed the opportunity.
The Australian dollar-denominated gold rose to reach a record high of A$2,241.52 on 7 August 2019, which in turn, provided a boost to the gold miners, and the share prices of the ASX-listed gold miners are sailing high.
The current rally in the gold price has boosted the earning of the most lucrative gold mine in Australia- Cadia Gold Mine, hosted by the Newcrest Mining Limited (ASX: NCM). In the middle of the gold rush, the market is expecting the company to shortly confirm the Cadia mine earnings, which as per the market speculation crossed the level of A$1 billion.
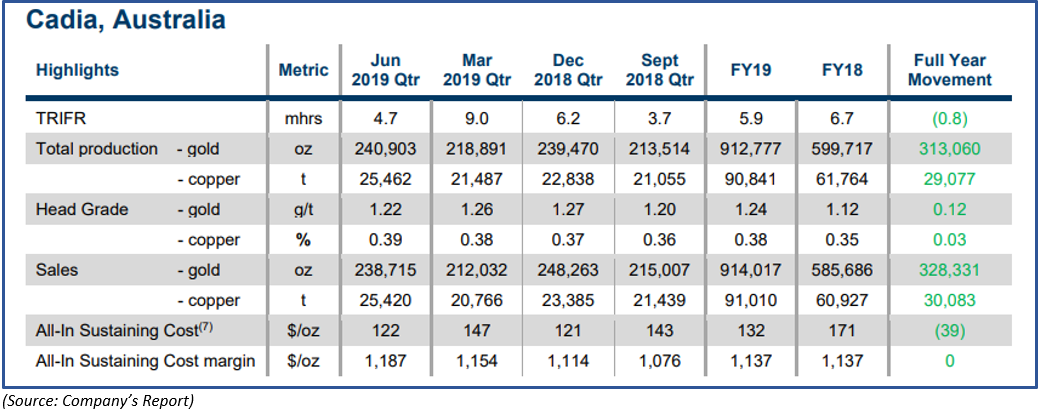
Cadia June 2019 Quarter Performance:
The flagship gold mine of NCM operated at a record annualised mill throughput rate of 31.7 million tonnes per annum and produced 240,903 ounces of gold during the June 2019 quarter, up by over 10 per cent as compared to the previous corresponding quarter.
The annual production from the Cadia Gold Mine stood at 912,777 ounces of gold in FY19, which in turn, underpinned the growth of over 52 per cent against the production of 599,717 ounces of gold in FY18.
On the cost counter, the gold mine witnessed a sharp quarterly and annual decline, and the all-in sustaining cost (AISC) of gold production stood at A$122 per ounce in June 2019 quarter, down by over 17 per cent against the previous corresponding AISC of A$147 per ounce.
The annual AISC of the mine stood at A$132 per ounce in FY19, down by almost 23 per cent against the previous financial year AISC of A$171 per ounce.
The increase in the mill throughput rate supported high gold production despite lower grade processing and reduced recovery. NCM utilised a head grade of 1.22 g/t of gold during the June 2019 quarter, as compared the previous corresponding quarter head grade of 1.26g/t of gold.
Cadia Progress:
Post the release of the Independent Technical Review Board Report in April 2019 over the Northern Tailings Storage Facility embankment slump. The company expended the geotechnical drilling and foundation assessment around the Northern Tailings Storage Facility along with the Southern Tailings Storage Facility.
NCM would incorporate the data from the expended geotechnical drilling into the new Southern Tailings Storage Facility Stage 7 design, which is pending finalisation before the commencement of the Stage 7 lift. NCM is progressing over the Northern Tailings Storage Facility Repair Concept Study, which is anticipated by the company to be completed in the December 2019 quarter.
The Cadia operations of the company continue to deposit tailings into the Southern Tailings Storage Facility and in the Cadia Hill open pit tailings storage facility. NCM would submit an application to use the third tailings storage at Cadia Hill open pit, and once or if approved the Cadia Hill tailings storage coupled with the Southern Tailings Storage Facility would provide Cadia gold operations about 10 of tailings storage capacity at the current processing rate.
To counter the drought problem in New South Wales, NCM pursed several water supply options and mitigation activities. NCM mentioned that the drought conditions in New South Wales, where NCM operates its Cadia Gold Mine would not affect the FY2020 production.
Whatâs Coming Ahead?
Apart from the A$1 billion expectation from the Cadia operations, the market is expecting an announcement related to the recent agreement entered by the company.
On 11 March 2019, NCM mentioned that the company entered into an agreement with Imperial Metals Corporation to acquire 70 per cent interest along with the operatorship of the Red Chris Gold Mine and surrounding tenements in Canada for consideration for A$806.5 million.
The company is expected to deliver a statement over the fulfilment of the conditions, which was initially required to close the Red Chris transaction. NCM would also publish its annual report this week.
NCM and The Red Chris:
Red Chris mine owned by the Imperial Metals Corporation is a modest copper and gold producing open pit in British Columbia, Canada, which produces under 35,000 tonnes of copper and 38,000 ounces of gold per year.
NCM intends to convert the Red Chris into an underground block cave operation to target the copper and gold resources buried beneath the surface. The intention of the company echoes through the investing community as the Cadia operations of the company showed a metamorphosis to become one of the largest gold mines across the globe from low-grade operations at the initial stage.
As per the company, the Red Chris contains over 20 million ounces of gold and 13Blbs of copper, which makes the prospect a large metal endowment. NCM also anticipates that the presence of high-grade mineralisation is amenable to bulk underground mining.
XAU/AUD on Charts:
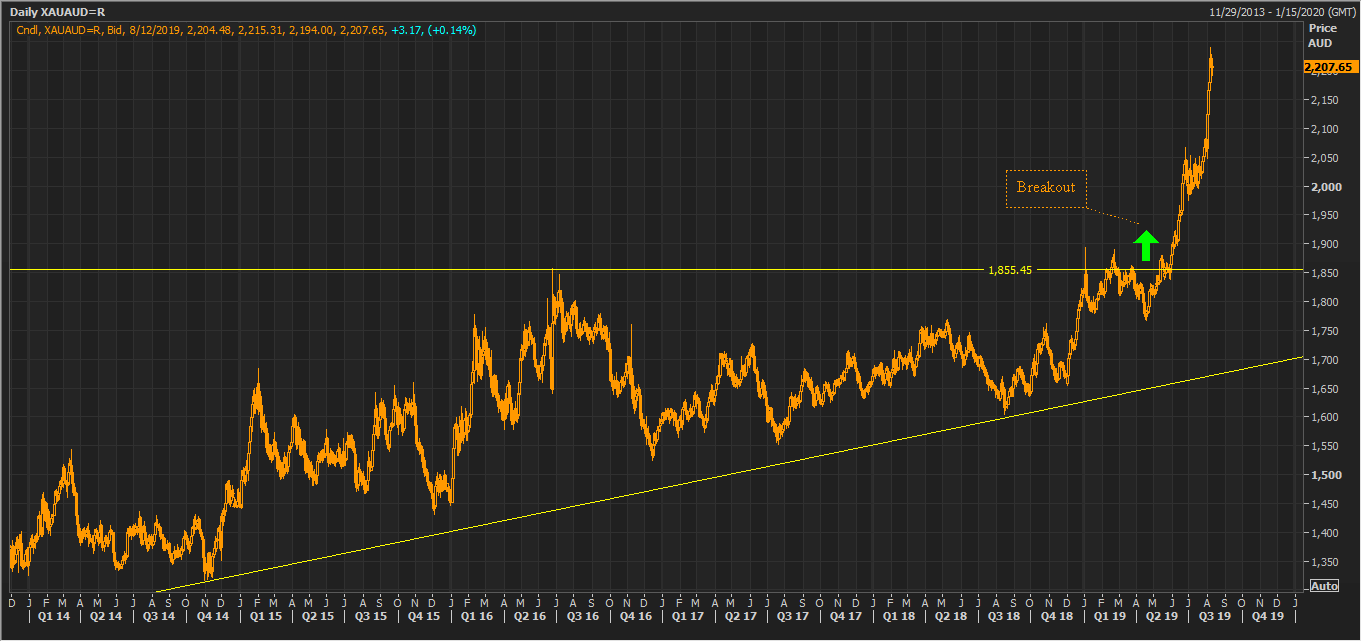 XAU/AUD Daily Chart (Source: Thomson Reuters)
On the daily chart, the Australian dollar-denominated gold prices crossed its initial hurdle at A$1,855.45 and gave a breakout on the daily chart with the prices reaching a record high. However, the rally in the gold prices is now on a halt.
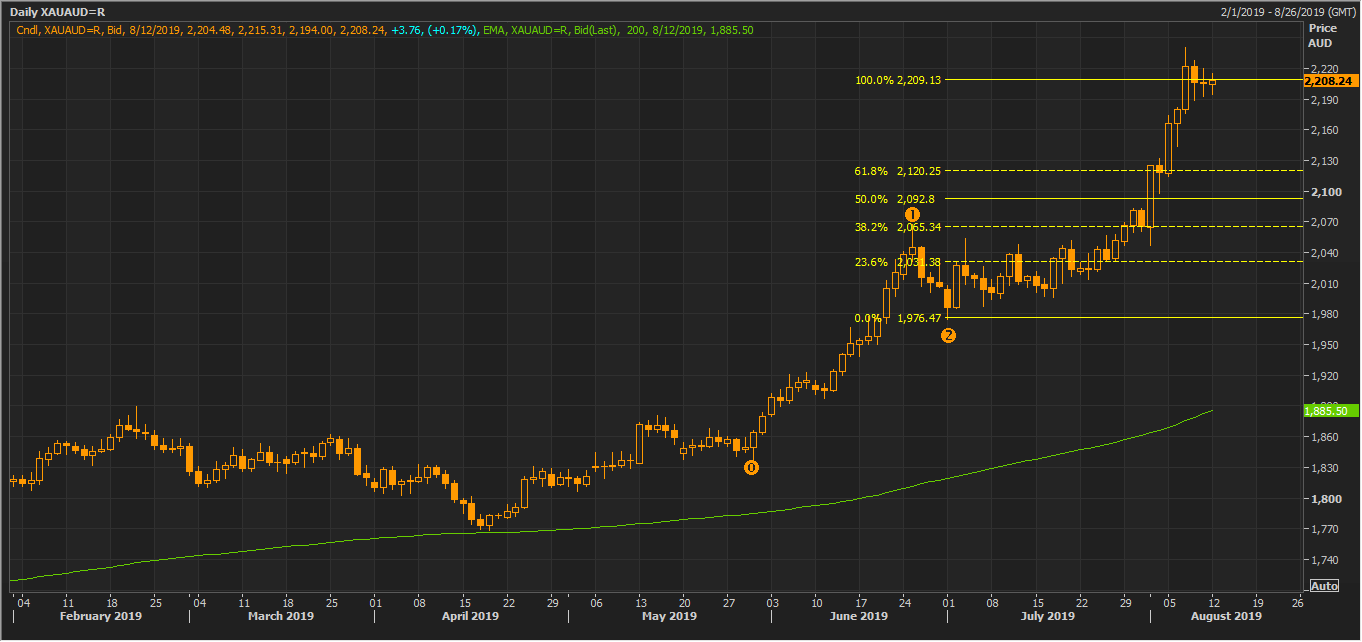 XAU/AUD Daily Chart (Source: Thomson Reuters)
On extending the Fibonacci series, the prices are currently hovering around the 100.0 per cent projected level, which is at A$2,209.13. The gold prices are trading above the 200-days exponential moving average. Post connecting the Fibonacci Series from 0,1,2 the gold prices revealed the primary hurdle at 100.0 per cent, and investors should monitor this level closely as a break above and sustain or failure to do so would decide further directional movement in gold prices.
Also Read: Technical Zoom Over Precious Metals; Silver Outperforms Gold
NCM on Charts:
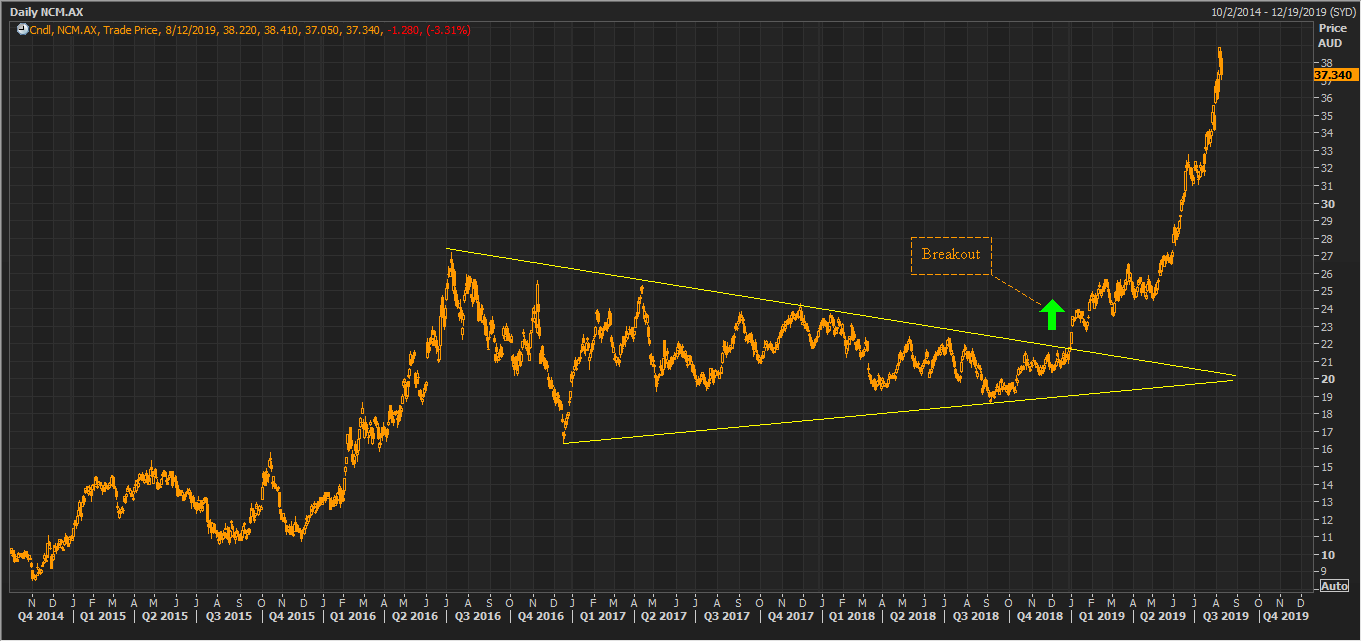 NCM Daily Chart (Source: Thomson Reuters)
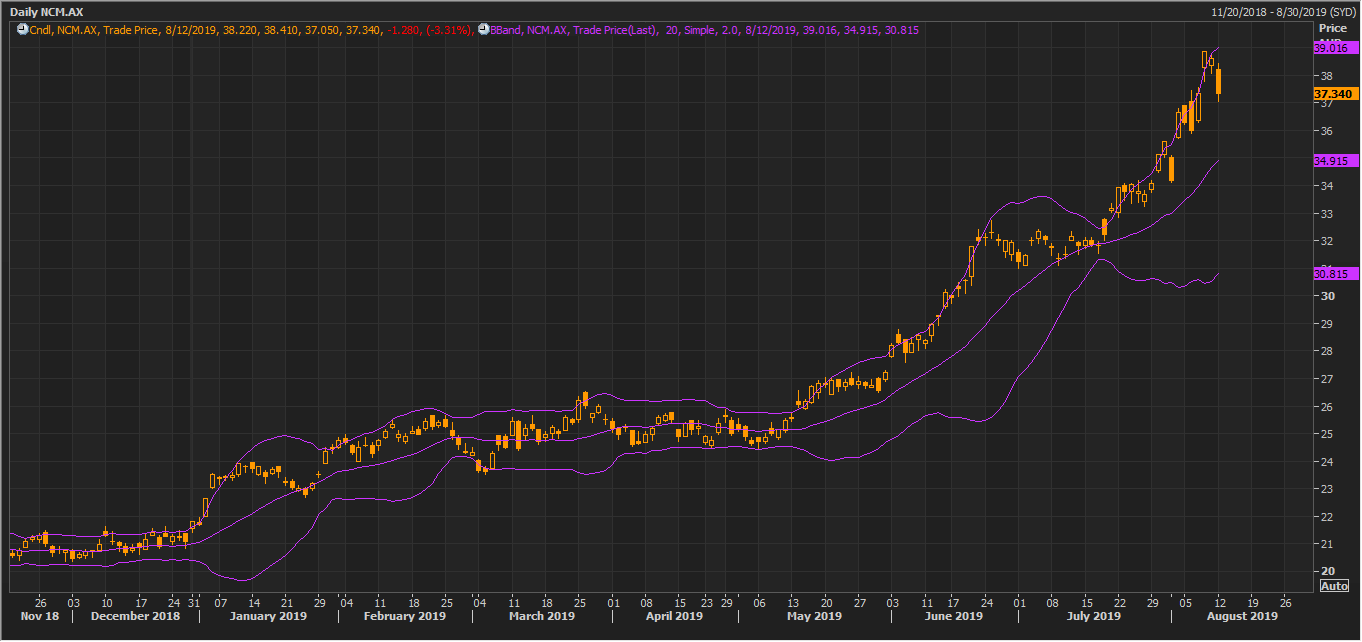
On the daily chart, the share prices of the company crossed the bullish symmetrical triangle (bullish pattern) formation and rose to the rose to the level of A$38.870 on 9 August 2019. However, the prices the stock of the company are trading lower, on 13 August 2019, at A$37.145, down by 0.522% as compared to its previous close (as at AEST: 12:42 PM).
 NCM Daily Chart (Source: Thomson Reuters)
On applying the 20-days simple Bollinger band, we can observe that the share prices of the company crossed the upper band of the Bollinger; however, the prices were unable to sustain above it and retraced back. The academics in such cases suggests the prices move towards the media to remain in line with the average price.
 NCM Daily Chart (Source: Thomson Reuters)
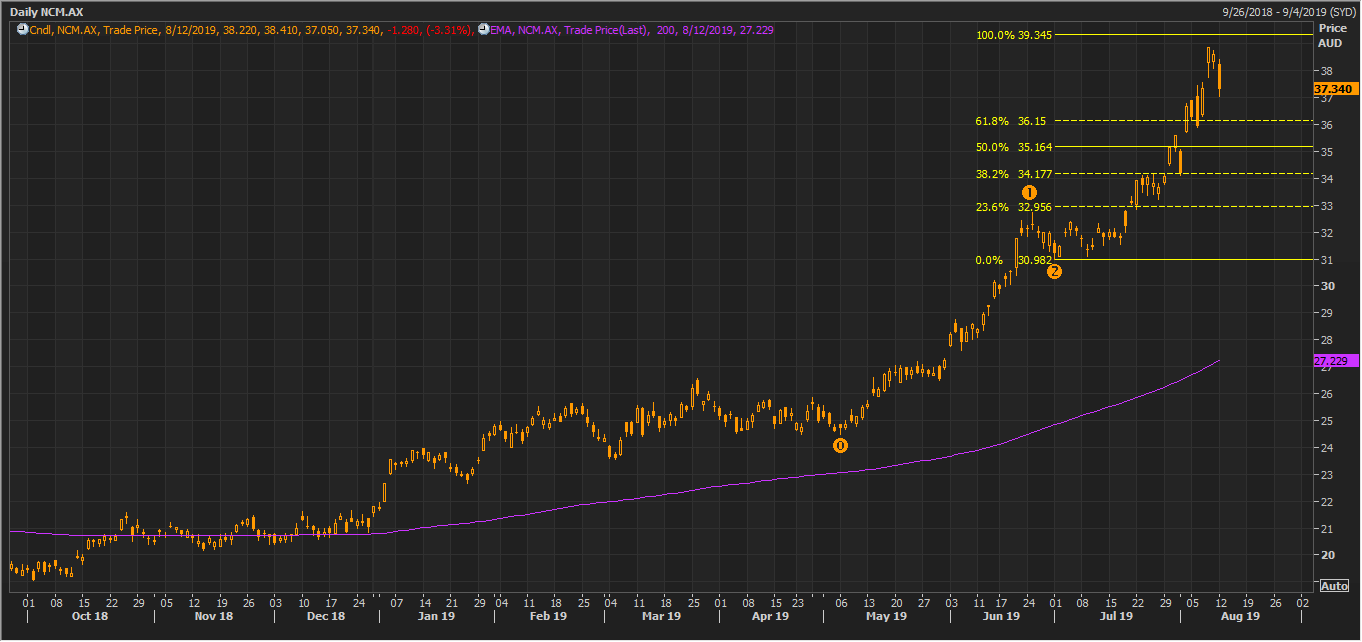
On observing the wave moment and connecting the Fibonacci Series through the projection points 0,1,2, we can see that the prices are unable to breach the 100.0 per cent projected level, which is at A$39.345. The level of 100.0 per cent could now act the primary hurdle for the share prices of the company, and investors should monitor the level to reckon the price movement ahead.
Disclaimer
This website is a service of Kalkine Media Pty. Ltd. A.C.N. 629 651 672. The website has been prepared for informational purposes only and is not intended to be used as a complete source of information on any particular company. Kalkine Media does not in any way endorse or recommend individuals, products or services that may be discussed on this site. Our publications are NOT a solicitation or recommendation to buy, sell or hold. We are neither licensed nor qualified to provide investment advice.
