


When it comes to the selection of securities while investing in stock market, an investor has three broad choices, such as small-cap, mid cap and large-cap stocks. In the article below we will be discussing about mid cap stocks. The mid-cap stocks are generally identified by their high risk and high return expectations. On a long-term perspective, every investor looks for above-average appreciation potential of stocks. Mid-cap companies generally possess that potential. When compared to the large caps, mid-caps possess more risk.
Letâs have a look at four ASX-listed mid-cap companies with their recent updates:
Freedom Foods Group Limited
ASX-listed food producer Freedom Foods Group Limited (ASX: FNP) is primarily involved in the sourcing, manufacturing, selling, marketing and distribution of plant based beverages, dairy and nutritional ingredient products, consumer nutritional products and specialty cereal and snacks.
A look at Site Tour Presentation
- Recently, the company has published a site tour presentation, wherein it stated that it has invested $430 million over the last three years.
- The company mentioned that it has presence in around 10,000 - 15,000 outlets with a potential universe of more than 50,000. In the upcoming 12-18 months, it would look to increase outlet distribution to 30,000 outlets.
Notice and Agenda of 2019 AGM
FNP through a release announced that it will be conducting its Annual General Meeting for the year 2019 on 15th November 2019 and following will be the key business items:
- To adopt Remuneration Report
- Re-elect Ronald Perich as a Director
- Re-elect Trevor Allen as a Director
- To decide on Directorsâ remuneration pool.
Notable Rise in Net Sales Revenue
- For the year ended 30th June 2019, FNP reported a rise of 34.9% in net sales over the prior corresponding period and the figure stood at $476.2 million.
- The operating EBITDA of FNP reached to $55.2 million, reflecting a rise of $16 million.
- Freedom Foods Group Limited recorded an operating net profit after tax of $21.9 million, which increased 40.1% on the prior corresponding period. This implies increased operating EBDITA, offset by higher depreciation costs over pcp.
On the price performance of the stock, Freedom Foods Group Limited was last traded at a price of A$5.600 per share with a fall of 1.582% on the trading session of 24th October 2019. It experienced a rise of 8.38% in the time frame of six months.
Nearmap Ltd
Nearmap Ltd (ASX: NEA) is involved into the provisioning of geospatial map technology for business, enterprises and government customers.
Change in Directors Interest
- The company through a release dated 23rd October 2019 updated the market that Mr Ross Norgard has made a change to holdings in the company by transferring 2,000,000 fully paid ordinary shares between 18- 21 October 2019.
- When it comes to consideration, 1 million shares have been transferred to Mrs Jennifer Lee Norgard from Longfellow Nominees Pty Ltd in her personal capacity with respect to an order of the Family Court of Western Australia (WA).
- In addition, there was a transfer of 1 million shares in relation to a loan facility with the loan amount, which is equal to 63% Loan to Value Ratio.
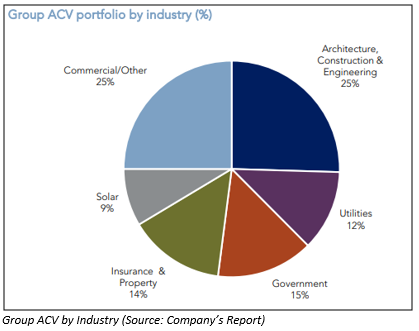
Record Surge in ACV (Annualised Contact Value)
- Financial year 2019 has been a year, where company achieved various triumphs, and posted record portfolio growth as it delivered a change in its product offering like Nearmap as well as its beta release of Artificial Intelligence content.
- The annualised contract value witnessed a record surge of 36% or $24.0 million and the figure reached to an amount of $90.2 million. It added that currently North America comprises of over one third of the total portfolio.
- When it comes to statutory revenue, there was a rise of 45% to $77.6 million as compared to prior corresponding period.
- In FY19, the company witnessed a rise of 11% to 9,800 in global subscriptions, with average revenue per subscription of the group at $9,208, up 23% on prior corresponding period.
- However, the sales team contribution ratio of NEA happens to be strong at 106%, which include the increased investment made in 2H FY19 in NA sales and marketing.
Cash Position
- As at 30th June 2019, the cash balance of the group stood at $75.9 million as compared to $17.5 million as of 30th June 2018. However, excluding the capital raise initiatives, core business cash balance was $17.8 million, a rise of $0.3 million.
- The company reported strong net operating cash inflows, which stood at $24.9 million as the business benefits from continuing operational leverage.
On the price performance of the stock, Nearmap Ltd was last traded at a price of A$2.820 per share with a fall of 5.051% in the trading session of 24th October 2019. It experienced a fall of 8.33% in the time frame of six months.
Zip Co Limited
Zip Co Limited (ASX: Z1P) offers point-of-sale credit as well as payment solutions to customers and provides numerous integrated retail finance solutions to merchants throughout a number of industries, online as well as in-store.
Issue of Securities
- Zip Co Limited has issued 795,538 fully paid ordinary shares at the price consideration of $3.43 per ordinary share on 1st October 2019.
- The shares have been issued pursuant to employee incentive plan approved by shareholders at the 2018 Annual General Meeting.
Acquisition of Spotcap
- The company through a release dated 6th September 2019 announced that it has inked an agreement in order to acquire Spotcapâs Australian and New Zealand businesses. Spotcap is a provider of global SME lending.
- The acquisition of ANZ businesses of Spotcap help Z1P with a proven SME credit decisioning platform that has been live in market since 2015 and originated more than $200 Mn in credit lines on the platform.
- The signing of acquisition agreement also helps the company to an accelerated âgo to marketâ strategy with respect to recently announced Zip Biz âbuy now, pay laterâ product in ANZ.
Financial Statistics of Z1P
- The financial year 2019 has been a year, where it witnessed a continuous rapid growth in customer accounts, transactions as well as revenue. It successfully inked many $1bn+ enterprise accounts to the platform, as well as successfully rolled out the Zip App.
- The revenue and transaction volume soared up to 138% and 108% and the figures stood at $84.2 million and $1,128.5 million, respectively.
- Zip experienced a rise of 115% to $682.6 million at 30 June 2019 in customer receivables as compared to $316.7 million at 30 June 2018.
- However, the monthly repayments stayed healthy at around 13%-14% of closing balance of the previous month, which implies that customers are repaying their entire balance in just 7- 8 months on an average.
Cash and Debt
As at 30th June 2019, the cash balance of Zip stood at $12.6 million, which include the restricted cash of $6.4 million. When it comes to debt, Z1P has utilised $587.5 million out of facilities amounting to $631.5 million.
On the stockâs performance front, Zip Co Limited was last traded at a price of A$4.250 per share with a rise of 3.659% on the trading session of 24th October 2019. It experienced a rise of 79.04% in the time frame of six months.
Bravura Solutions Limited
Bravura Solutions Limited (ASX: BVS) is primarily involved in the development, licensing as well as maintenance of highly specialised administration and management software applications. The company would be conducting its Annual General Meeting for 2019 on 26th November 2019.
Shares Issued Under DRP
- On 27th September 2019, the company has issued 439,440 fully paid ordinary shares at the consideration of $4.39 per Share.
- The shares have been issued with respect to the companyâs DRP pursuant to final dividend paid on 27 September 2019.
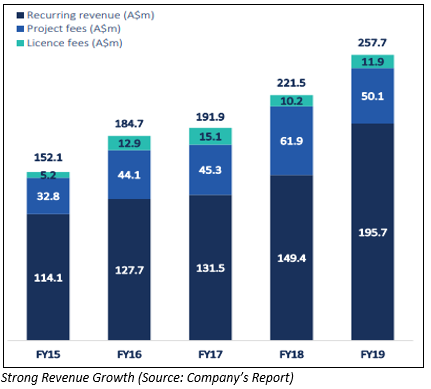
Strong FY19 Results
- While reporting results of financial year 2019, the company stated that FY19 has been another year of robust growth throughout the broad product suite in combination with continued operating leverage expansion.
- The company experienced a rise of 16%, 27% and 21% in revenue, EBITDA and NPAT and the figures were at A$257.7 million, A$49.1 million and A$32.8 million, respectively.
- It stated that the funds administration has generated growth due to increased implementation and project work and reported FY19 revenue from funds administration of A$80.9 million with a rise of 22% over the prior corresponding period.
- The operating cash flow of the company stood at A$46.5 million in FY19, reflecting cash conversion of 95% as compared to 120% in FY18.
On the stockâs performance front, Bravura Solutions Limited was last traded at a price of A$3.780 per share with a fall of 4.786% on the trading session of 24th October 2019. It experienced a fall of 28.47% in the time frame of six months.
Disclaimer
This website is a service of Kalkine Media Pty. Ltd. A.C.N. 629 651 672. The website has been prepared for informational purposes only and is not intended to be used as a complete source of information on any particular company. Kalkine Media does not in any way endorse or recommend individuals, products or services that may be discussed on this site. Our publications are NOT a solicitation or recommendation to buy, sell or hold. We are neither licensed nor qualified to provide investment advice.
