


Crude oil prices have witnessed a strong September 2019 so far, and the prices of benchmark Brent Crude futures had breached previous three months high over the recent attack on Aramcoâs crude processing facilities.
To Know more, Do Read: Aramco Fire Fuelled ASX Energy Stocks; United States SPR to Rebalance the Supply Chain?
The soaring crude oil prices were welcomed by the ASX-listed oil & gas explorers. Crude oil prices act as a benchmark for many other liquid fuels such as LNG, propane, kerosene, etc., and the recent rise in the crude oil fanned the prices of these liquid fuels in the international market.
The rise in the prices of liquid fuels is benefiting the ASX-listed oil & gas explorers, and many oil & gas explorers on the Australian Securities Exchange have witnessed a strong price gain till now.
Also Read: Understanding Crude Oil Dynamics Through The Web Of Global Influencers
Status Quo of the Oil Market
Due to the recent geopolitical events, the Brent oil futures rose from the level of US$57.23 (Dayâs low on 03 September 2019) to the level of US$71.95 (Dayâs high on 16 September 2019), which underpinned the growth of over 25 per cent.
However, post the announcement from the United States of including Strategic petroleum Reserves in the supply chain, the prices plunged to trade at US$64.48 (as on 24 September 2019 01:24 PM AEST). Apart from the announcement from the United States, an announcement made by the oil Kingpin Saudi Arabia also exerted pressure on oil prices.
Saudi Arabia assured the global market over its ability to restore the supply chain quickly; however, Aramco recently reduced the grade of oil exported by the state-owned company to JX Nippon Oil & Energy Corporation in Japan, raising eyebrows on Saudiâs ability to restore the supply chain in the short-run.
The uncertainty surrounding Saudiâs ability to quickly restore its damaged facility is further adding to the speculations and providing cushion to the oil prices.
Oil & Gas Explorers
The oil & gas explores have felt the heat of EIA forecast and the falling crude oil prices in the international market; however, the recent events in the oil markets have supported the stock prices of the oil and gas explorers.
To know More, Do Read: EIA Forecast Brings More Shock Waves For ASX-listed Oil & Gas Explorers
The global oil markets are currently in an ambivalent situation, where the dark clouds over the global oil demand due to subdued growth are preventing the oil prices from setting an uptrend; however, the geopolitical tensions are disturbing the supply chain leading to a sudden spike in the prices and thus inducing high volatility.
Many energy investors are flocking towards the more stable alternative resources of energy to safeguard their investment against the high volatility in the oil market.
To Know More, Do Read: ASX-Listed Alternative Energy Stocks Under Investorsâ Lens as Oil Risk Surmounts
Volatility in the Oil Market

LCO Daily Chart (Source: Thomson Reuters)
On the daily chart, the 14-day simple Bollinger Band is showing the larger distance between the lower line and the upper line with a spike in volumes, which in turn, suggests high volatility in the oil market. The width of the 14-day simple Bollinger Band is increasing on the daily chart, and the prices are diverging above the mean average (the central line) with a sudden increase in volume.
ASX-Listed Oil & Gas Explorers
Woodside Petroleum Limited (ASX: WPL)
WPL rose from the level of A$30.930 (Dayâs low on 4 September 2019) to the level of A$33.840 (Dayâs high on 16 September 2019), up by over 9 per cent over the rise in crude oil prices.
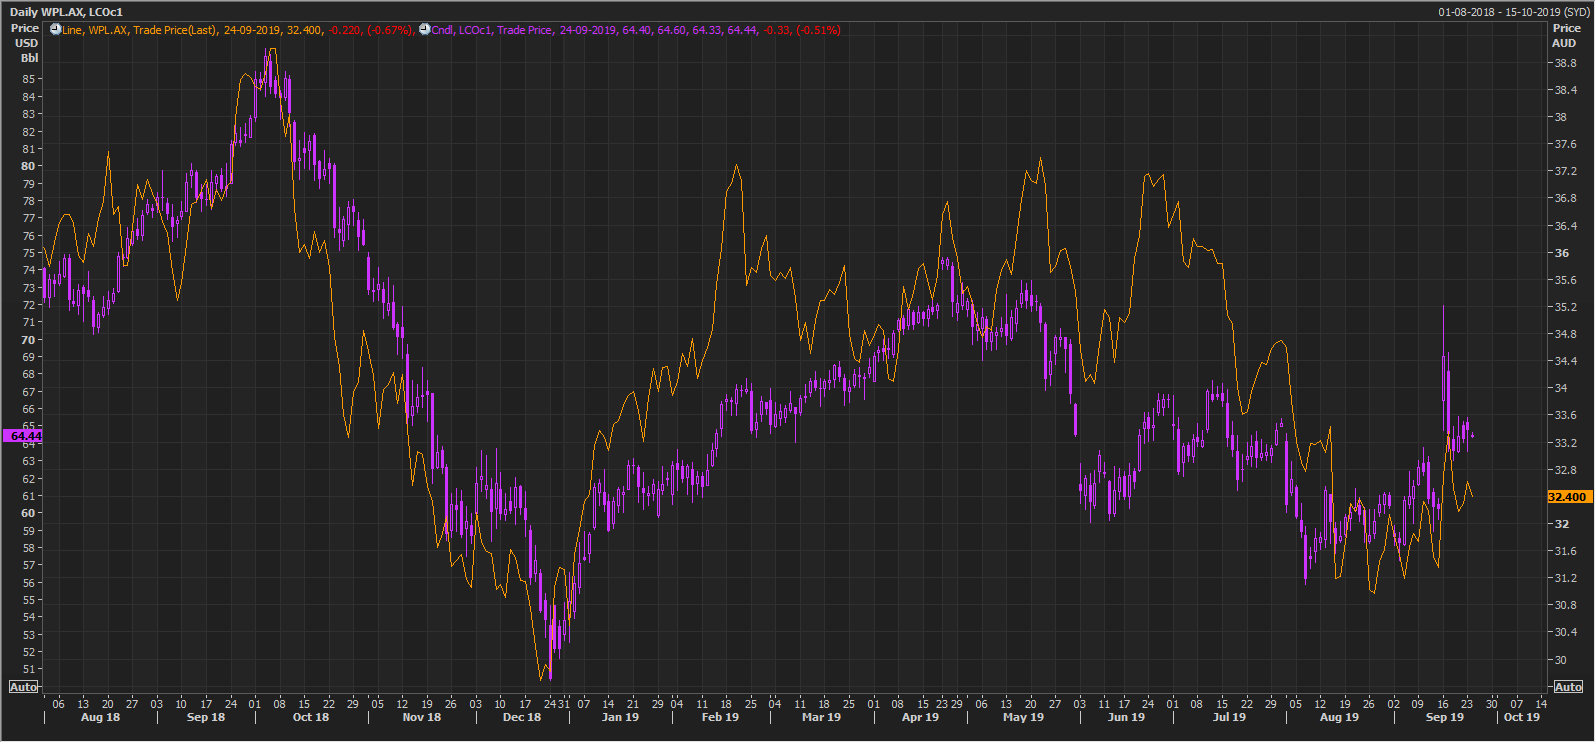
WPL and LCO Trend Movement (Source: Thomson Reuters)
The oil and & gas producer typically tracks the crude oil price movement as the revenue of the company gets influenced by the change in the market price of crude oil.
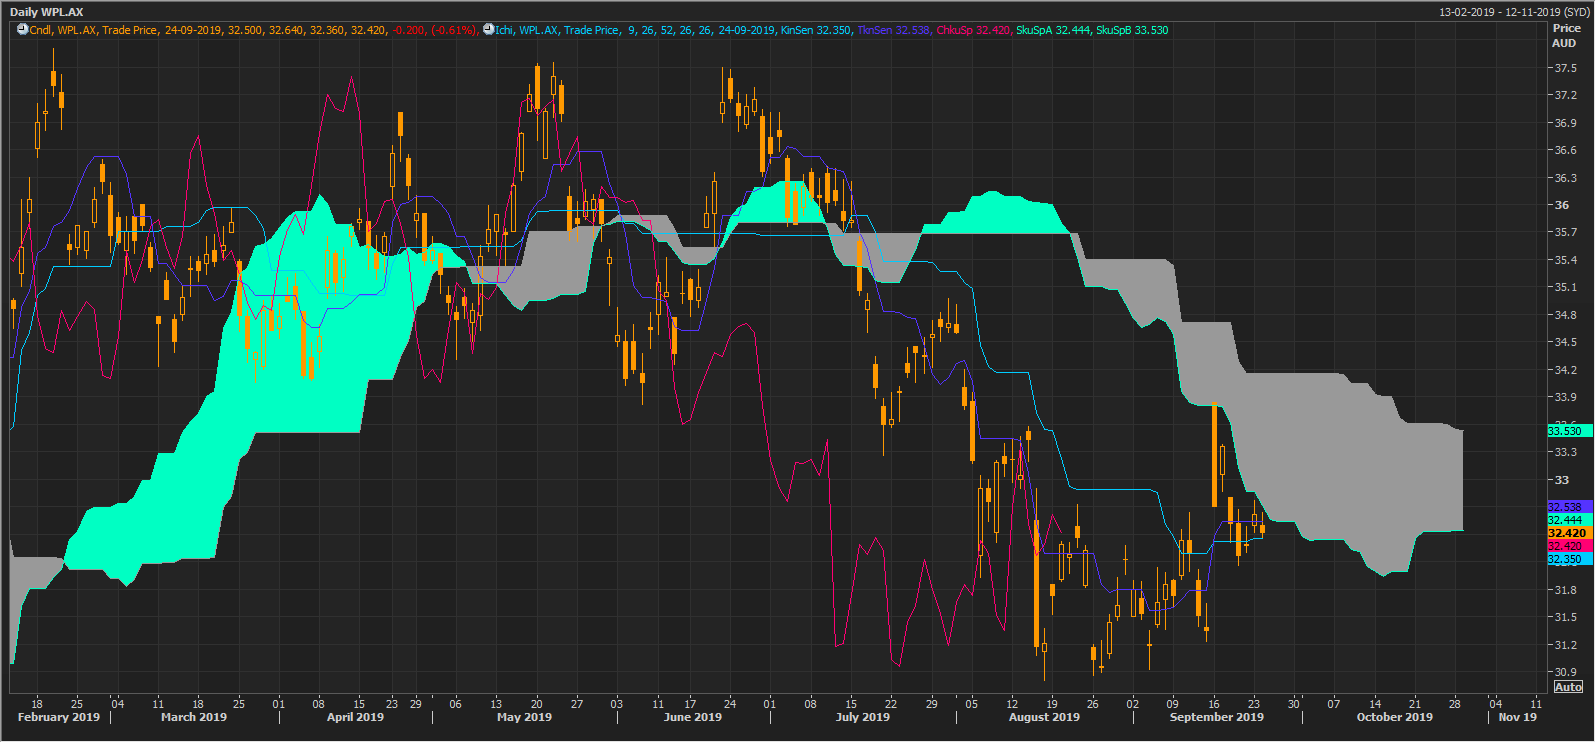
WPL Daily Chart (Source: Thomson Reuters)
Post applying the Ichimoku on the daily chart, we can observe that Span A (mean of the base and conversion line), which is at A$32.444, is below the Span B (mean of 52-day high and low), which is at A$33.530, which in turn, suggests that the current trend is a downtrend.
The prices recently took a spike to touch the cloud (grey) and took a hurdle and fell back; however, the conversion line or the mean of 9 days high and low is crossing the base line or the mean of 26 days high and low from below, which represents a positive crossover.
However, the crossover took place below Span A, which is not a very strong positive signal. The width between the Span A and Span B is large, which suggest the downtrend still has steam left.
Returns
WPL delivered a return of 0.93 per cent (MTD) and underperformed the 6.64 per cent return (MTD) provided by the crude oil.
Oil Search Limited (ASX: OSH)
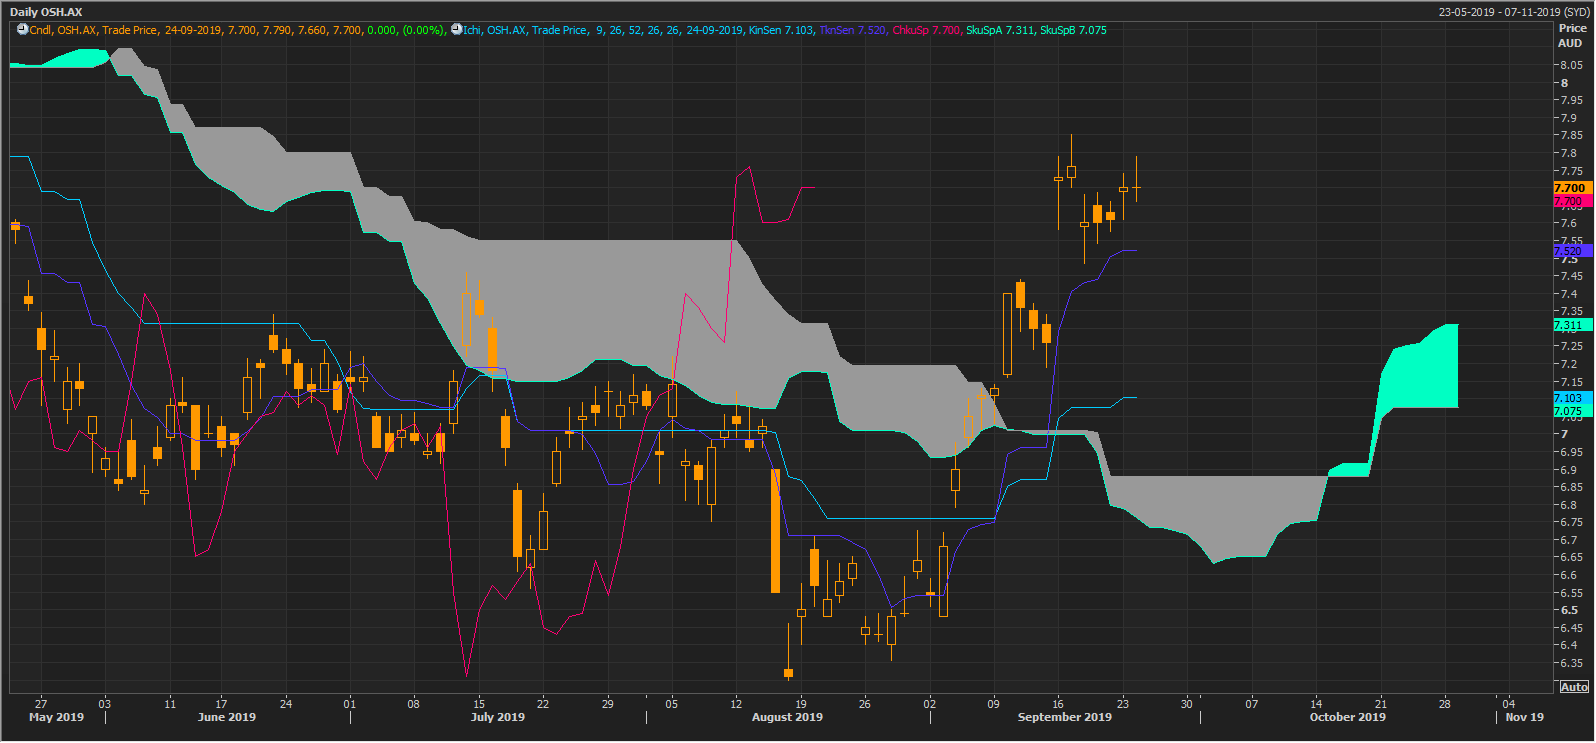
OSH Daily Chart (Source: Thomson Reuters)
On the daily chart, Span A, which is at A$7.311 of Ichimoku is trading above Span B, which is at 7.075, which suggests a change in trend over the short-term. The conversion line is crossing the base line from below, which shows a positive crossover.
The cloud (light blue) will act as the support, if the prices take any short-term correction. The crossover is not yet strong as it took place above the Span B; however, the Span A and Span B are separating far with Span A moving above Span B, which in turn, suggests early signs of short to medium-term uptrend.
Return
OSH delivered a return of 17.38 per cent on an MTD basis and outperformed the 6.64 per cent return (MTD) provided by the crude oil.
Origin Energy Limited (ASX: ORG)
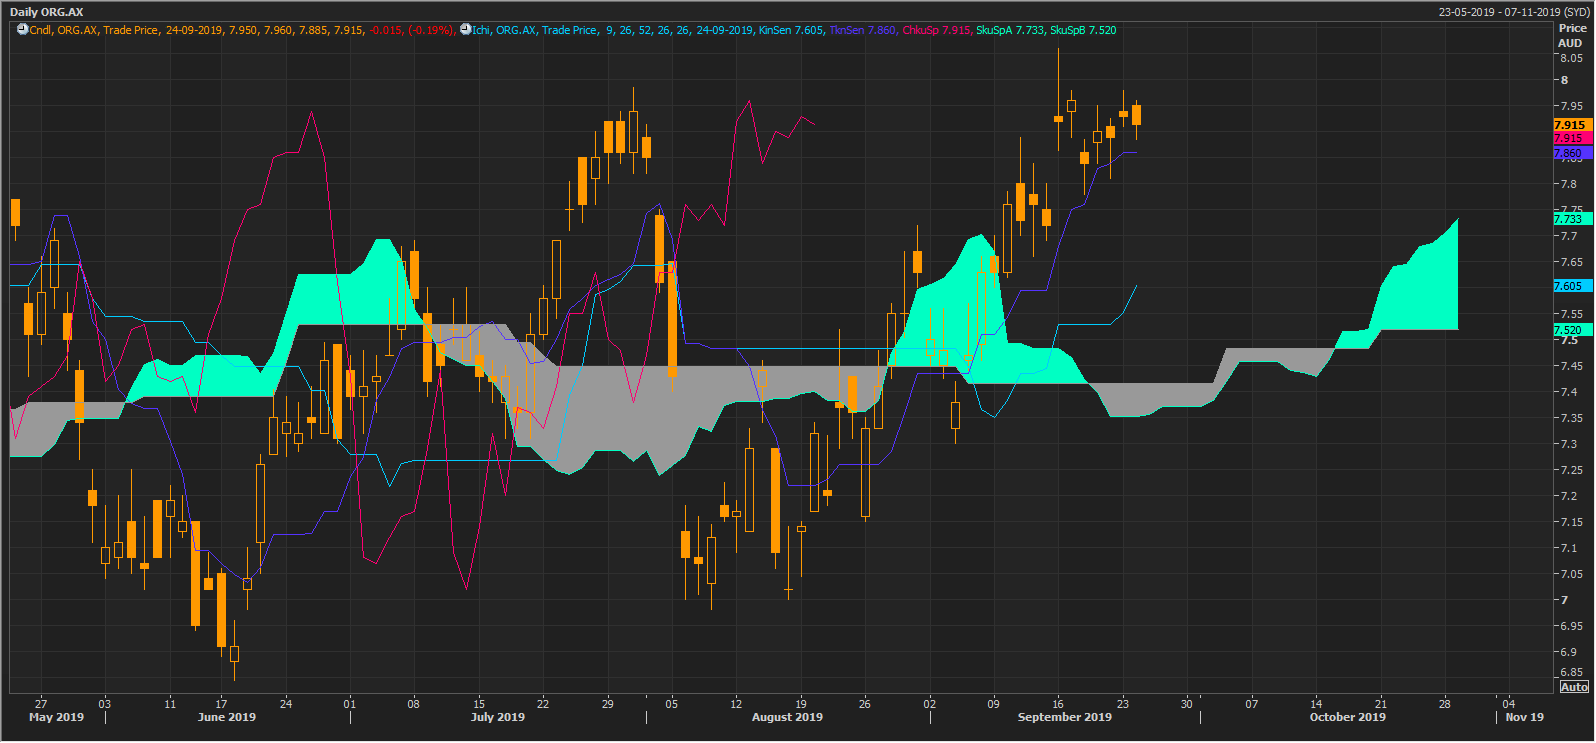
ORG Daily Chart (Source: Thomson Reuters)
On the daily chart, Span A (A$7.733) is trading above the Span B (A$7.520), and the gap between both the spans are distancing apart, which in turn, suggests the establishment of an uptrend. The conversion line of the Ichimoku is crossing the base line from below, above the light blue cloud (formed after Span A crossed the Span B), which in turn, represents a strong bullish signal.
Return
OSH delivered an MTD return of 6.69 per cent to marginally outperform the MTD return of 6.64 per cent provided by the crude oil.
Beach Energy Limited (ASX: BPT)
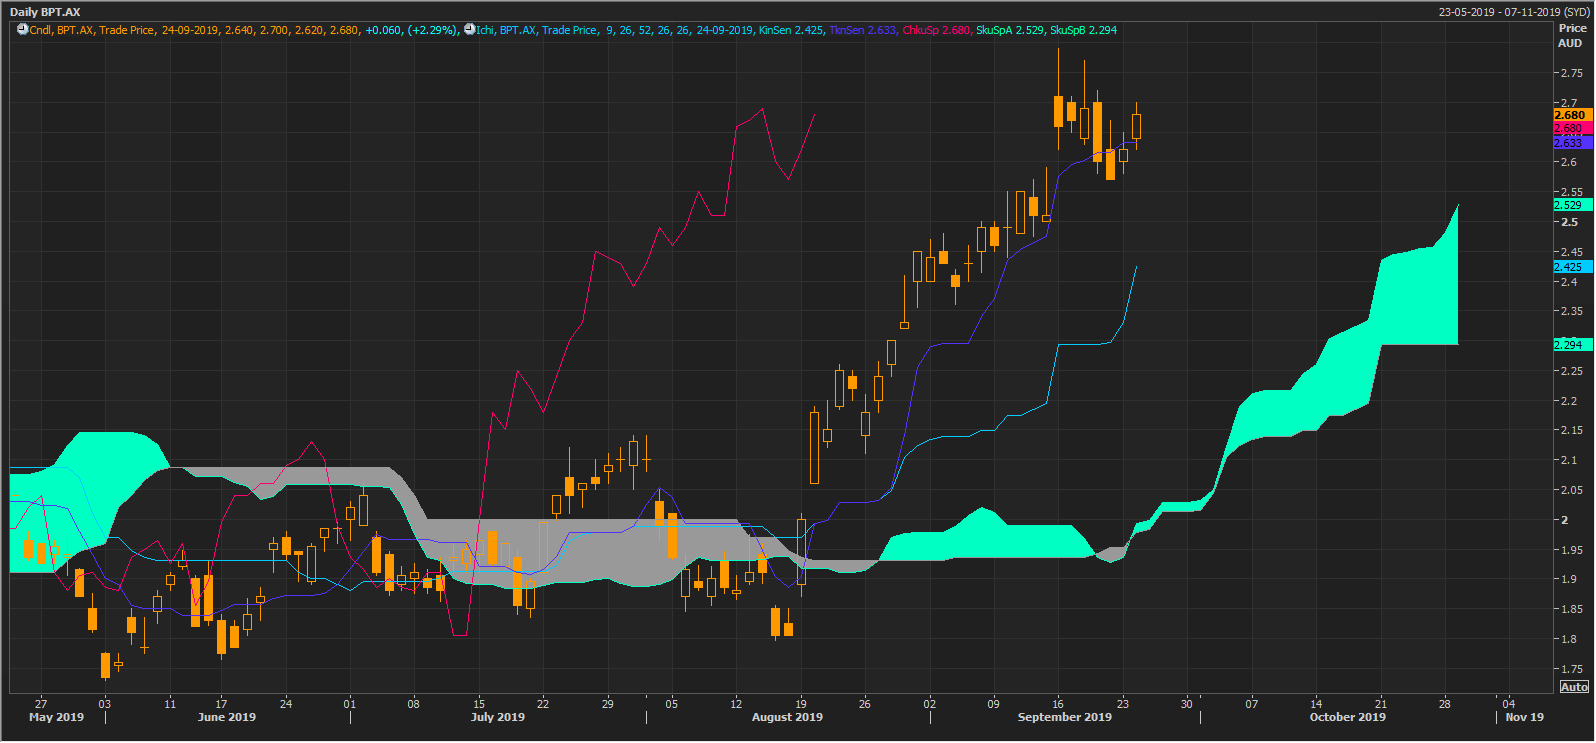
BPT Daily Chart (Source: Thomson Reuters)
On the daily chart, the Span A is well-spaced from the Span B and is currently at A$2.529, which in turn, suggests an establishment of a short to medium-term uptrend. The cloudy area could act as support for the share prices of the company.
The conversion line is crossing the base line from below and above the light blue cloud, which in turn, represents a strong bullish signal.
Return
BPT delivered a return of 9.59 per cent on an MTD basis and outperformed the crude oil performance on an MTD basis.
Disclaimer
This website is a service of Kalkine Media Pty. Ltd. A.C.N. 629 651 672. The website has been prepared for informational purposes only and is not intended to be used as a complete source of information on any particular company. Kalkine Media does not in any way endorse or recommend individuals, products or services that may be discussed on this site. Our publications are NOT a solicitation or recommendation to buy, sell or hold. We are neither licensed nor qualified to provide investment advice.
