
 AUS
AUS
 NZ
NZ
 UK
UK
 CA
CA
 USA
USA
 IND
IND






Highlights
- NVIDIA Corporation’s (NASDAQ:NVDA) revenue surged 68% YoY in Q2, FY22.
- The net sales of ASML Holdings N.V. (NASDAQ:ASML) were €4.02 billion in Q2, FY21.
- The NVDA stock jumped 65.17% YTD, while ASML grew by 67.06% YTD.
Stocks of NVIDIA Corporation (NASDAQ:NVDA) and ASML Holdings N.V. (NASDAQ:ASML) fell around 2% and 5% in the premarket session on Tuesday.
The NVDA stock was trading at US$211.35, down 2.42 percent, while the ASML stock traded at US$792.64, down 5.11 percent, at 8:15 am ET from their previous closing prices.
Here we look at the recent developments of the two companies.
Also Read: Red Cat (RCAT) stock rides high after NASA contract, stock jumps 50%
NVIDIA Corporation (NASDAQ:NVDA)
NVIDIA is a Santa Clara, California-based technology company that specializes in graphics processing units (GPUs) and semiconductors for gaming and other industries.
The stock has been in the limelight as it supplies vital components to some of the fastest-growing sectors like gaming, artificial intelligence, and crypto mining.
Also Read: Dow Jones closes higher, S&P 500, Nasdaq drift after tech losses
It has a market cap of US$541.50 billion, while its P/E ratio and the forward P/E one-year ratio are 77.22 and 60.67, respectively. The EPS is US$2.80.
The stock logged a 52-week high and low of US$230.43 and US$115.67, respectively. Its trading volume was 24,521,510 on Sep 27. The stock surged 65.17 percent YTD.
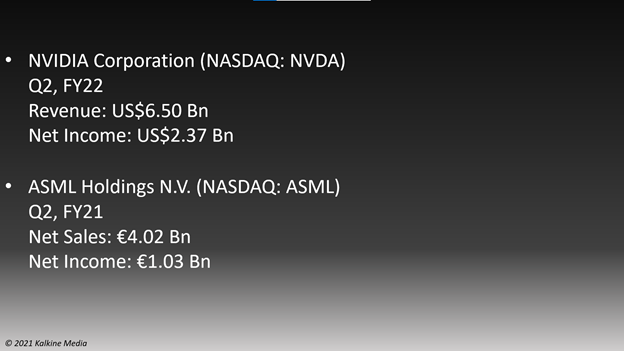
On a GAAP basis, the revenue jumped 68% YoY to US$6.50 billion in Q2, FY22. The net income rose from US$622 million, or US$0.25 per diluted share, in Q2, FY21, to US$2.37 billion, or US$0.94 per diluted share in Q2, FY22.
Also Read: Top five stocks to keep an eye on this week
ASML Holdings N.V. (NASDAQ:ASML)
ASML is one of the leading semiconductor equipment manufacturing companies based in the Netherlands. The stock saw significant traction in recent sessions. It is also one of the most-watched stocks amid the supply chain constraints.
ASML’s market cap is US$345.25 billion. The P/E ratio and the forward P/E one-year ratio are 60.93 and 51.95, respectively. The EPS is US$13.71. The stock grew 67.06 percent YTD.
Also Read: Why are Tesla Inc (TSLA) & Rivian Inc catching the eyes of investors?
The stock’s 52-week highest and lowest prices were US$895.93 and US$357.38, respectively. On Sep 27, its trading volume was 1,063,868.
The net sales were €4.02 billion in Q2, FY21, compared to €4.36 billion in the previous quarter. Its net income came in at €1.03 billion, or €2.52 per share, compared to €1.33 billion, or €3.21 per share in Q1, FY21.
The Netherlands-based firm expects its net sales to be between €5.2 billion and €5.4 billion in Q3, FY21.
Also Read: 10 reasons why US should plan for a digital currency
Bottomline
The technology sector grew rapidly over the past year as the US economy recovered from covid slowdown. However, tech stocks have been retreating in recent days amid various developments at home and abroad. The Federal Reserve has signaled that it might start withdrawing its asset-buying program as early as November and consider a rate hike by 2022. However, investors should evaluate the companies carefully before investing in stocks.
