


Highlights
- H&R Block, Inc. (NYSE:HRB) has a P/E ratio of 5.7, and its dividend yield is 4.17%.
- Tenneco Inc. (NYSE:TEN) has a P/E ratio of 38.83 and a forward P/E one year of 4.16.
- Universal Technical Institute Inc's (UTI) P/E ratio is 17.06, and the forward P/E one year is 19.57.
The retail industry comprises durable and non-durable finished goods, such as apparel, books, toys, furniture, electronics, pharmaceuticals, garden supplies, auto parts, etc.
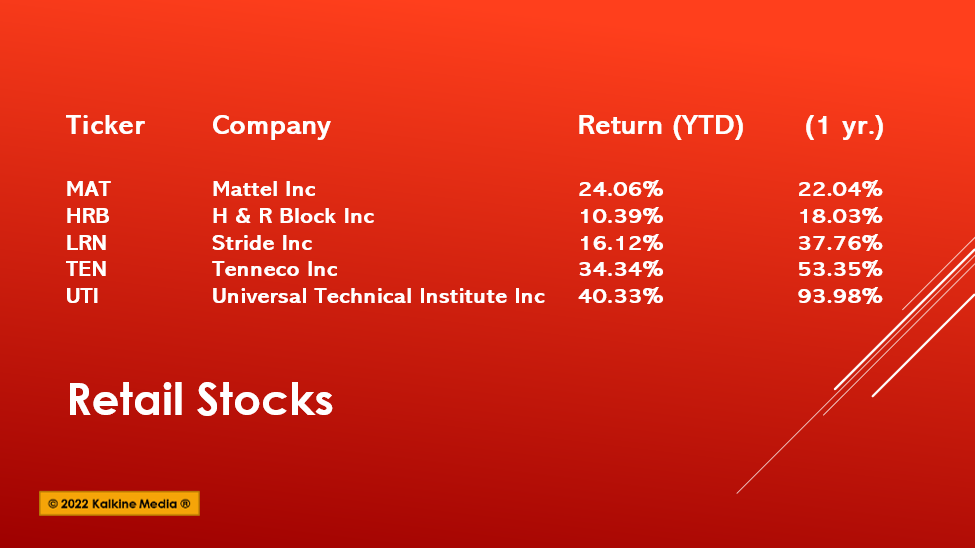
US retail sales grew 0.5% in March 2022, boosted by higher consumer spending. Restaurants, malls, concerts, gym, etc., also saw high footfalls during the period. Here we discuss five stocks under US$50 that returned more than 10% gains YTD and over 15% in one year.
Also Read: SYY to KO: 5 inflation-beating consumer staple stocks to watch in Q2
Mattel, Inc. (NASDAQ:MAT)
Closing price on May 4: US$26.97
Price range in 52 weeks: US$26.99 to US$17.95
El Segundo, California-based Mattel Inc. is a toy products company. It products are for both wholesale and retail customers. Its products include toys, games, puzzles, etc., and sold under brands such as Barbie, Hot Wheels, Fisher-Price, American Girl, and Thomas & Friends.
For the first quarter ended March 31, 2022, its net sales were up 19% to US$1,041 million, compared to US$874 million in the previous year.
Its net income was US$21 million or US$0.06 per share diluted compared to a net loss of US$112.4 million or US$0.32 per share diluted in Q1, 2021.
Mattel Inc. has a market capitalization of US$9.5 billion. Its P/E ratio is 9.11, and the forward P/E for one year is 18.22.
Also Read: IGT, CHDN to MGM: Top sports betting stocks to watch in Q2
Also Read: 5 agriculture stocks to explore as food inflation spikes: ADM to FMC
H&R Block, Inc. (NYSE:HRB)
Closing price on May 4: US$26.06
Price range in 52 weeks: US$28.50 to US$21.08
H&R Block Inc offers services like income tax return, do-it-yourself online tax solutions, etc. The Missouri-based company provides services through its offices, franchises, and online tax software.
It will release its third-quarter results on May 10, 2022.
For the quarter ended December 31, 2021, its revenue was US$158.8 million compared to US$142 million in the same quarter of the previous year.
The company posted a net loss of US$190.6 million or US$1.10 per share diluted compared to a net loss of US$255.8 million or US$1.39 per share diluted in the same period a year ago.
The stock has a market capitalization of US$4.21 billion. Its P/E ratio is 5.7, and the forward P/E for one year is 8.89. The dividend yield is 4.17%, with an annualized dividend of US$1.08.
Also Read: PLD to SPG: Can these 5 REIT stocks provide hedge against inflation?
Stride, Inc. (NYSE:LRN)
Closing price on May 4: US$38.60
Price range in 52 weeks: US$41.20 to US$25.55
Herndon, Virginia-based Stride Inc is an online educational company. It offers alternative programs to traditional on-campus schooling. Stride operates state-funded virtual schools in the US. It generates a significant part of its revenue from the contracts with school districts.
The company reported revenue of US$421.7 million for the quarter ended March 31, 2022, compared to US$392.1 million in the year-ago period.
Its net income came in at US$42.9 million or US$1.02 per share diluted compared to US$23.8 million or US$0.57 per share diluted in the March quarter of 2021.
Also Read: Top blockchain stocks to explore: COIN, CME, RIOT, MARA & BITF
On May 4, it announced the launch of ‘The Professional Development Center’, a growing content library that includes hands-on training, on-demand professional development courses, and live events for educators to enhance their expertise and student outcomes.
The stock has a market capitalization of US$1.62 billion. Its P/E ratio is 17.91, and the forward P/E for one year is 15.26.
Also Read: SND to PVL: Five penny energy stocks to watch in Q2
Tenneco Inc. (NYSE:TEN)
Closing price on May 4: US$16.40
Price range in 52 weeks: US$22.75 to US$9.51
Tenneco Inc. is an auto parts company based in Lake Forest, Illinois. It provides emissions-control products that optimize engine performance, improves fuel economy, acoustically tune vehicle engine sound, and meets air-quality norms.
Its products also provide improved braking, steering, and acceleration.
For the quarter ended March 31, 2022, it posted a net loss attributable to the company of US$38 million or US$0.46 per share diluted on revenue of US$4.65 billion.
For the same quarter in 2021, the revenue was US$4.73 billion, and the net income was US$65 million, or EPS diluted of US$0.79. The stock has a market capitalization of US$1.36 billion. Its P/E ratio is 38.83, and the forward P/E for one year is 4.16.
Also Read: Top mining stocks to watch in Q2: AMR, X to AA
 Source: Pixabay.com
Also Read: NVDA to AMD: Will these 5 semiconductor stocks ride out supply crunch?
Universal Technical Institute Inc (UTI)
Closing price on May 4: US$10.96
Price range in 52 weeks: US$11.16 to US$5.34
Universal Technical Institute Inc is an educational institution. The company provides undergraduate degree and certificate programs for automotive, diesel, motorcycle, collision repair, marine fields, etc. It is located in Phoenix, Arizona.
For the March quarter of 2022, the company reported revenue of US$102.1 million compared to US$77.7 million in the previous year.
The net income came in at US$7.35 million or US$0.11 per share diluted compared to a net loss of US$1.55 million or US$0.09 per share diluted in the March quarter of 2021.
The stock has a market capitalization of US$1.1 billion. Its P/E ratio is 17.06, and the forward P/E for one year is 19.57.
Also Read: Top material stocks to explore in Q2: FCX, NEM, CTVA, DOW & NUE
Bottom line:
The SPDR S&P Retail ETF (XRT) fell 18.5% YTD, while S&P 500 fell around 13% in the same period. Stock market is prone to volatility. Hence, investors should exercise due diligence before investing in stocks.
