

_07_03_2026_03_50_21_133108.jpg)

Highlights
- Marston’s total pub sales stood at £402 million for the year ended 2 October 2021.
- Revolution Bars Group pub sales grew by 17% during the 19 July 2021 and 2 October 2021 period compared to the same period in 2019.
- Loungers’ revenue for the year ended 18 April 2021 was £78.35 million compared to £166.50 million in 2020.
The economic growth in the UK garnered pace in August 2021 after a sudden decline in July due to the removal of remaining pandemic restrictions that benefited bars and restaurants. According to the Office for National Statistics (ONS), on account of rising spending on leisure, the country’s gross domestic product (GDP) expanded by 0.4% in August 2021.
Nevertheless, ONS reduced its GDP growth estimate for July due to a deeply impacted car manufacturing sector due to chip shortages and supply chain issues. The food service, hospitality, entertainment, leisure and arts sectors, which make up about 80% of the UK economy, are currently buzzing with action. In Scotland outdoor business for pubs were allowed from 26 April, while in Wales permission was there from as early as 12 April in England, while indoor trading was permitted from 17 May with social distancing restrictions. However, post 19 July, all restrictions on bars and pubs were lifted in the UK.
The rising holidaying trend and lifting of international travel restrictions have driven growth in the accommodations segment by 23% and air transport by 27.5% in August. The overall economy remained 0.8% below the pre-pandemic level in August. Here is a review of the investment prospect in three bar stocks – Marston’s, Loungers and Revolution Bars Group.
(Data source: EODHD/Others)
Marston's Plc (LON: MARS)
Marston’s is UK’s independent pub retailing and brewing company. For the quarterly period from 25 July to 2 October, the company’s sales in the managed and franchised pubs grew by 2% over 2019 levels. It’s overall trading since 12 April was 94% of 2019 figures that includes a temporary reduction in VAT on sales of non-alcoholic drinks and food sales.
Marston’s total pub sales stood at £402 million for the year ended 2 October 2021, representing 78% of 2020 figures due to the disruption caused by the pandemic. In its "Inside-Out" scheme the company The had invested around £2 million in Autumn/Winter 2020, that helped it to make almost 70 per cent of its pubs under outdoor trading restrictions, and since 17 May, the group’s entire estate of 1,500 pubs is operational.
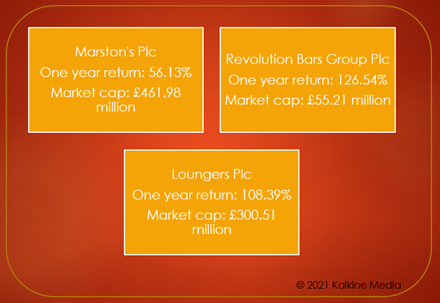
The shares of Marston’s are trading at GBX 73.95, up by 1.51% at 9:34 AM GMT+1 on 13 October 2021. As of 13 October 2021, Marston’s shares gave a return of 56.13% in the last one year to shareholders, and the market cap of the company currently stands at £461.98 million.
Revolution Bars Group Plc (LON: RBG)
Revolution Bars Group is a bar chain operating 67 premium bars based in England. For the period between 19 July 2021 and 2 October 2021, the company’s pubs registered a strong demand, and its sales grew by 17% compared to the same period in 2019. The company’s 56 sites based in England which had no trading restrictions during this period, registered 21% higher sales than 2019 levels.
Revolution Bars recorded 11,969 guest bookings in the first-week post reopening of the booking system for 17 May 2021 onwards.
The shares of Revolution Bars Group are trading at GBX 24.00 at 9:54 AM GMT+1 on 13 October 2021. As of 13 October 2021, Revolution Bars Group’s shares gave a return of 126.54% in the last one year to shareholders, and the market cap of the company currently stands at £55.21 million.
Loungers Plc (LON: LGRS)
Loungers is a UK-based operator of café/bars and restaurants. The company’s revenue for the year ended 18 April 2021 was £78.35 million compared to £166.50 million in 2020.
Loungers’ pre-tax loss reduced slightly from £14.78 million in 2020 to £14.72 million in 2021. Its adjusted EBITDA was £13.91 million in 2021 compared to £28.77 million in 2020.
The shares of Loungers are trading at GBX 292.50 at 10:10 AM GMT+1 on 13 October 2021. As of 13 October 2021, Loungers’ shares gave a return of 108.39% in the last one year to shareholders, and the market cap of the company currently stands at £300.51 million.
