


_07_03_2026_03_50_21_133108.jpg)

Summary
- TUI’s (LON:TUI) price witnessed an impressive rally in the last one month and added ~28.24% to March 29, 2021 low.
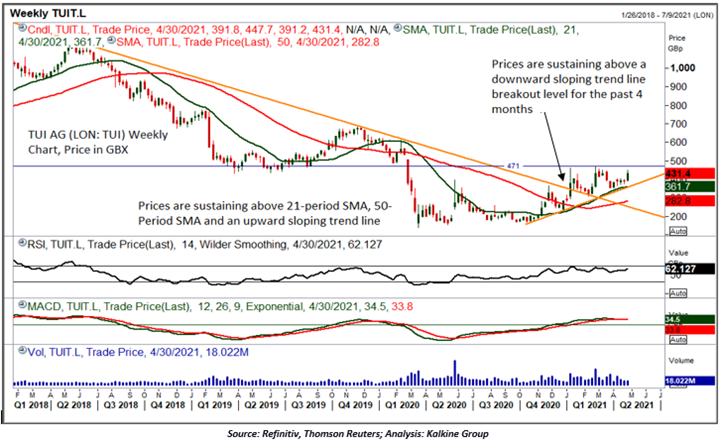
- On a weekly chart, TUI’s prices are sustaining above a downward sloping trend line breakout level for the past 4 months.
- Prices are trading above the trend-following indicator 21-period SMA and continuously taking support from it.
- The MACD line is sustaining above the centerline and indicating a positive direction; however, a narrow margin between the MACD line and the signal line indicating the probability of a negative crossover in near future.
TUI AG (LON:TUI) is a Travel and Leisure company and operates travel agencies, airlines, cruise ships, hotels, and resorts. TUI’s price witnessed an impressive rally in the last one month and added ~28.24% to March 29, 2021 low. TUI’s prices entered a bearish phase from the end of November 2019 that continued till the mid of March 2020 and prices witnessed a massive fall of ~80.00 percent in that period. After that the prices traded in a moderate bullish trend. Price has shown a decent gain of ~28.24% in the past one month from the low of GBX 349.10 made on March 29, 2021 to the recent high of GBX 447.70 formed on April 28, 2021.
On a weekly chart, prices are sustaining above a downward sloping trend line breakout level for the past 4 months and indicating an upside direction for the stock. Prices are continuously getting support from an upward sloping trend line at the lower levels and sustaining above the same for more than seven months. On the higher side, GBX 471 is acting as a crucial resistance level for the stock and the price action around the level will further provide cues about the stock's short-term trend.

Technical Indicator Analysis (On the weekly chart):
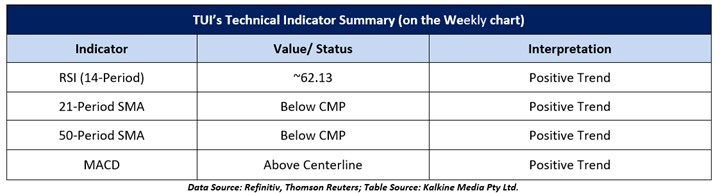
The momentum oscillator RSI (14-period) is trading at ~62.13 levels, indicating a positive trend for the stock. Prices are trading above the trend-following indicator 21-period SMA and continuously taking support from it. Prices are also sustaining above another trend-following indicator 50-period SMA that formed a positive crossover with the 21-period SMA. MACD line (Moving Average Convergence Divergence) is sustaining above the centerline and indicating a positive direction; however, a narrow margin between the MACD line and the signal line indicating the probability of a negative crossover in near future. The summary of technical indicators is as follows:
After analyzing the current price action coupled with the technical indicator, TUI AG seems to have bottomed out. Prices are sustaining above a downward sloping trend line breakout comfortably; however, on the higher side, GBX 471 is acting as a major support level for the stock. A decisive breakout above the resistance level backed by the volume may provide more confidence to the bulls.
