


US Markets: Broader indices in the United States traded on a mixed note - particularly, the S&P 500 index traded 5.97 points or 0.14 per cent higher at 4,390.60, Dow Jones Industrial Average Index dipped by 40.53 points or 0.12 per cent lower at 34,955.65, and the technology benchmark index Nasdaq Composite traded higher at 14,800.30, up by 67.00 points or 0.46 per cent against the previous day close (at the time of writing – 11:30 AM ET).
US Market News: The major indices of Wall Street traded on a mixed note amid stronger-than-expected inflation data. Inflation in June accelerated 5.4% YoY, massive jump since August 2008. Among the gaining stocks, Nokia (NOK) shares rose by about 8.4% after it hinted at an improved outlook for the year in its upcoming second-quarter results. PepsiCo (PEP) shares grew by around 1.30% after beating top-line and bottom-line estimates for the quarter driven by rising North American beverage sales. Hanesbrands (HBI) shares went up by about 3.20% after Wells Fargo upgraded it to “overweight”. Among the declining stocks, Boeing (BA) shares went down by about 2.20% after it announced a production rate cut for the 787 Dreamliner due to a production-related issue.
UK Market News: The London markets traded in a mixed note after the release of the British Retail Consortium (BRC) retail sales monitor and bank of England financial stability report. Same-store sales in the United Kingdom in June 2021 grew by 6.7% YoY.
FTSE 100-listed stocks such as British Land Co Plc and BP Plc shares plunged by around 1.60% and about 1.10%, respectively. British Land Co Plc mentioned that it would not grant further rent concessions to its tenants, whereas BP Plc mentioned its intentions to buy the entire ownership of its Thorntons joint venture.
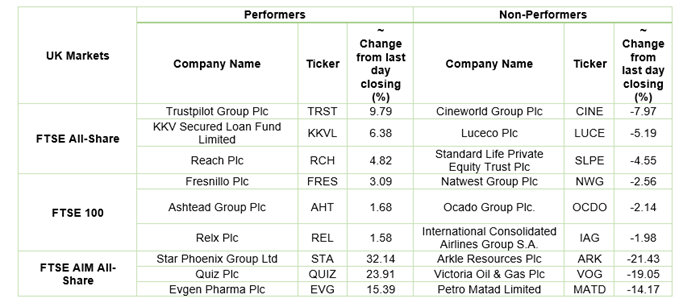
Trustpilot Group shares surged by around 7.60% after the Company reported a significant surge of 31% YoY in its H1 FY2021 revenue following the impact of the pandemic the previous year.
Star Phoenix Group shares went up by around 32.14% after it stated that it was evaluating a clean energy initiative. The Company has signed a non-binding agreement to explore hydrogen opportunities in Western Australia.
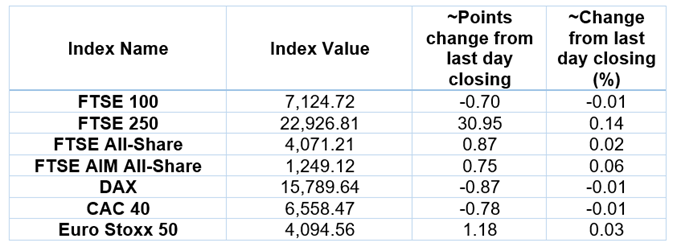
European Indices Performance (at the time of writing):
FTSE 100 Index One Year Performance (as on 13 July 2021)
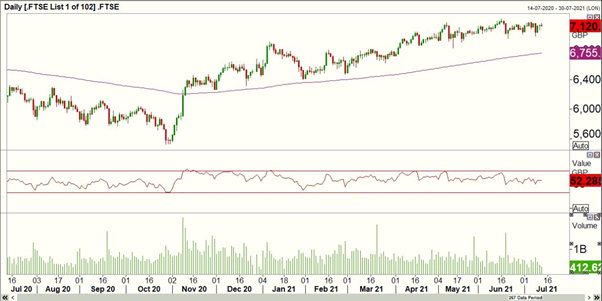
1 Year FTSE 100 Chart (Source: EODHD/Others)
Top 3 Volume Stocks in FTSE 100*: Lloyds Banking Group Plc (LLOY); Vodafone Group Plc (VOD); Rolls-Royce Holdings Plc (RR.).
Top 3 Sectors traded in green*: Industrials (+0.95%), Consumer Non-Cyclicals (+0.38%) and Utilities (+0.19%).
Top 3 Sectors traded in red*: Energy (-0.88%), Financials (-0.67%) and Basic Materials (-0.46%).
London Stock Exchange: Stocks Performance (at the time of writing)
Crude Oil Future Prices*: Brent future crude oil (future) price and WTI crude oil (future) price were hovering at $76.44/barrel and $75.28/barrel, respectively.
Gold Price*: Gold price was quoting at US$ 1,806.85 per ounce, up by 0.05% against the prior day closing.
Currency Rates*: GBP to USD: 1.3823; EUR to GBP: 0.8526.
Bond Yields*: US 10-Year Treasury yield: 1.415%; UK 10-Year Government Bond yield: 0.6340%.
*At the time of writing
