


Summary
- Procter & Gamble Co. (NYSE:PG) outperformed its peers and generated ~4.62 percent return in the last 3 months.
- PG stock prices are trading in a falling wedge formation on the daily chart and now taking the major support from the 50-period simple moving average (SMA).
- On the weekly chart, the stock price has broken out its falling channel pattern on an upside and the MACD generated a fresh positive crossover signal.
Procter & Gamble Co. (NYSE:PG) has shown a sharp recovery from the low of USD 121.54 made on March 04, 2021 to the recent high of USD 138.59 tested on April 20, 2021, a gain of ~14.03 percent in the last eight weeks. On Thursday, the stock prices closed at USD 135.14 level, up by 1.26%, and was one of the top gainers in the Dow Jones Industrial Average Index.
Procter & Gamble Co. Vs Johnson & Johnson Vs Colgate-Palmolive Co. (Peer Analysis)
Procter & Gamble Co. outperformed its peers with the overall return of 4.62 percent over the last 3 months, as evident from the below mentioned relative performance chart of the stocks. The second-best performing stock is Colgate-Palmolive Co. (NYSE:CL) which provided 3.28 percent returns followed by Johnson & Johnson (NYSE:JNJ) which has delivered 1.71 percent returns.
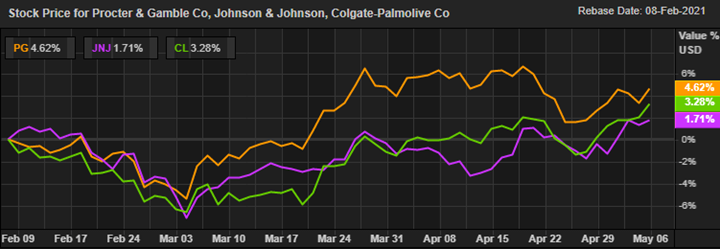
Source: EODHD/Others, Thomson Reuters; Analysis: Kalkine Group
The prices are trading in a rising wedge pattern for the last four months and currently hovering around the lower band of the pattern. Price has broken out of its falling trendline (black color horizontal line in the below chart) at USD 133.60 level and continuously sustaining above the trendline support. Prices were under pressure after hitting the 52-week high of USD 146.92 on November 09, 2020 and formed a low of USD 121.54 in March 2021, a decline of ~17.28 percent thanks to profit booking.
Procter & Gamble Co. on the daily chart
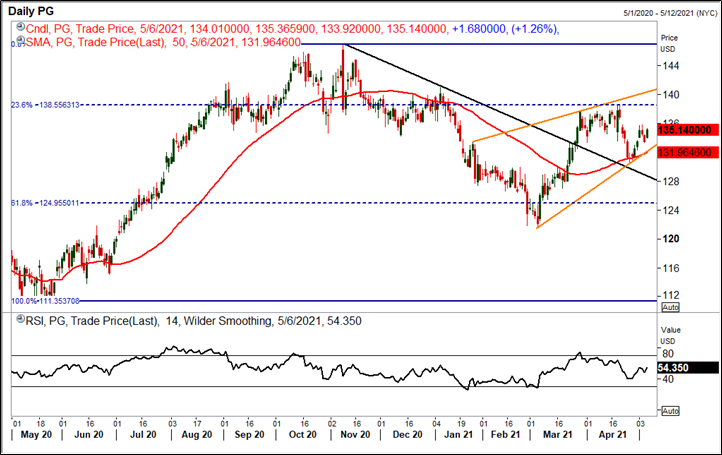
Source: EODHD/Others, Thomson Reuters; Analysis: Kalkine Group
The stock is trading above the 61.8% Fibonacci retracement support level at USD 124.95 of the previous rally (from USD 111.35 to USD 146.92) on the daily chart. Moreover, the price is trading above its 50-period SMA, acting as a crucial support level near the falling trendline. The momentum oscillator RSI (14-period) is trading at ~54 levels, indicating a possibility of further upside movement in the stock towards the resistance zone.
Procter & Gamble Co. on the weekly chart
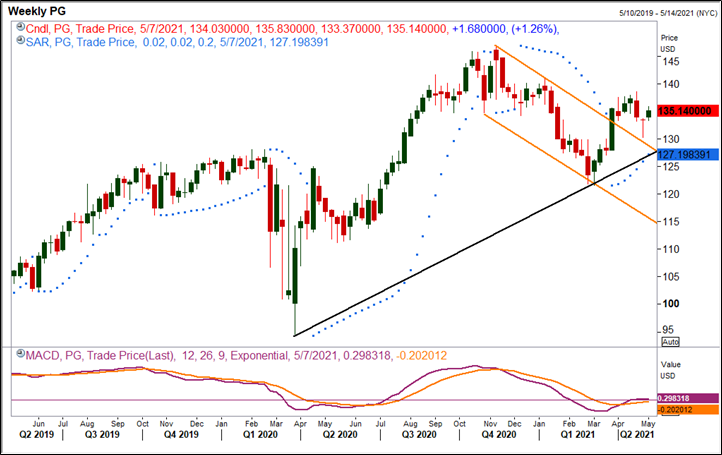
Source: EODHD/Others, Thomson Reuters; Analysis: Kalkine Group
On the weekly chart, the stock has broken out of its descending channel pattern at USD 133.30 level on 26 March 2021. After consolidating for more than five months in a channel pattern, the price registered a decisive breakout that suggests a change in the trend from sideways to upward. The stock prices are trading above an upward sloping trendline support level of USD 121 (black color line in the above chart). Further, the prices are trading above the Parabolic SAR indicator, which is acting as an immediate support zone for the stock near the upward sloping trendline. MACD is also showing a positive crossover and trading above the centerline further indicates an upside direction for the stock.
Based on the above chart analysis and technical outlook, Procter & Gamble Co.’s price seems to be in the recovery phase and currently approaching the key resistance zone. The chart pattern suggests that there might be more action expected in PG if the price breaks the important resistance levels.
