
 AUS
AUS
 NZ
NZ
 UK
UK
 CA
CA
 USA
USA
 IND
IND







Highlights
- The latest Australian Bureau of Statistics (ABS) data reveals that residential property prices saw the highest annual growth on record during the December 2021 quarter.
- The record-low interest rates encouraged consumer borrowing and property demand.
- Housing price growth was higher than the growth in the prices of attached dwellings.
Property prices in Australia have had an interesting journey, with the previous year observing a significant rise in prices. The latest data released by the Australian Bureau of Statistics (ABS) reveals that residential property prices displayed the strongest annual growth on record in the December 2021 quarter.
GOOD READ: Australia Pension Centrelink - 5 critical facts to notice now
The Residential Property Price Index, which shows the weighted average of the residential housing prices in eight capital cities, rose 4.7% in the December 2021 quarter. However, over the last 12 months, residential property prices surged by 23.7%, the strongest since the series began in the September quarter 2003.
What Is Housing Bubble? - Real Estate Bubble Explained
Australia’s property demand has been rising since the Reserve Bank kept record-low interest rates in November 2020, encouraging consumer borrowing. Under this expansionary economic climate, housing prices have reached unpalatable levels, rising at an unforeseen rate.
DO NOT MISS: Federal Budget 2022-23: Key talking points that should be on agenda
The latest ABS data highlights the significant impact that rebounding demand has had on property prices during the last year.
Here are three key points to note from the ABS data:
-
All capital cities observe an annual rise
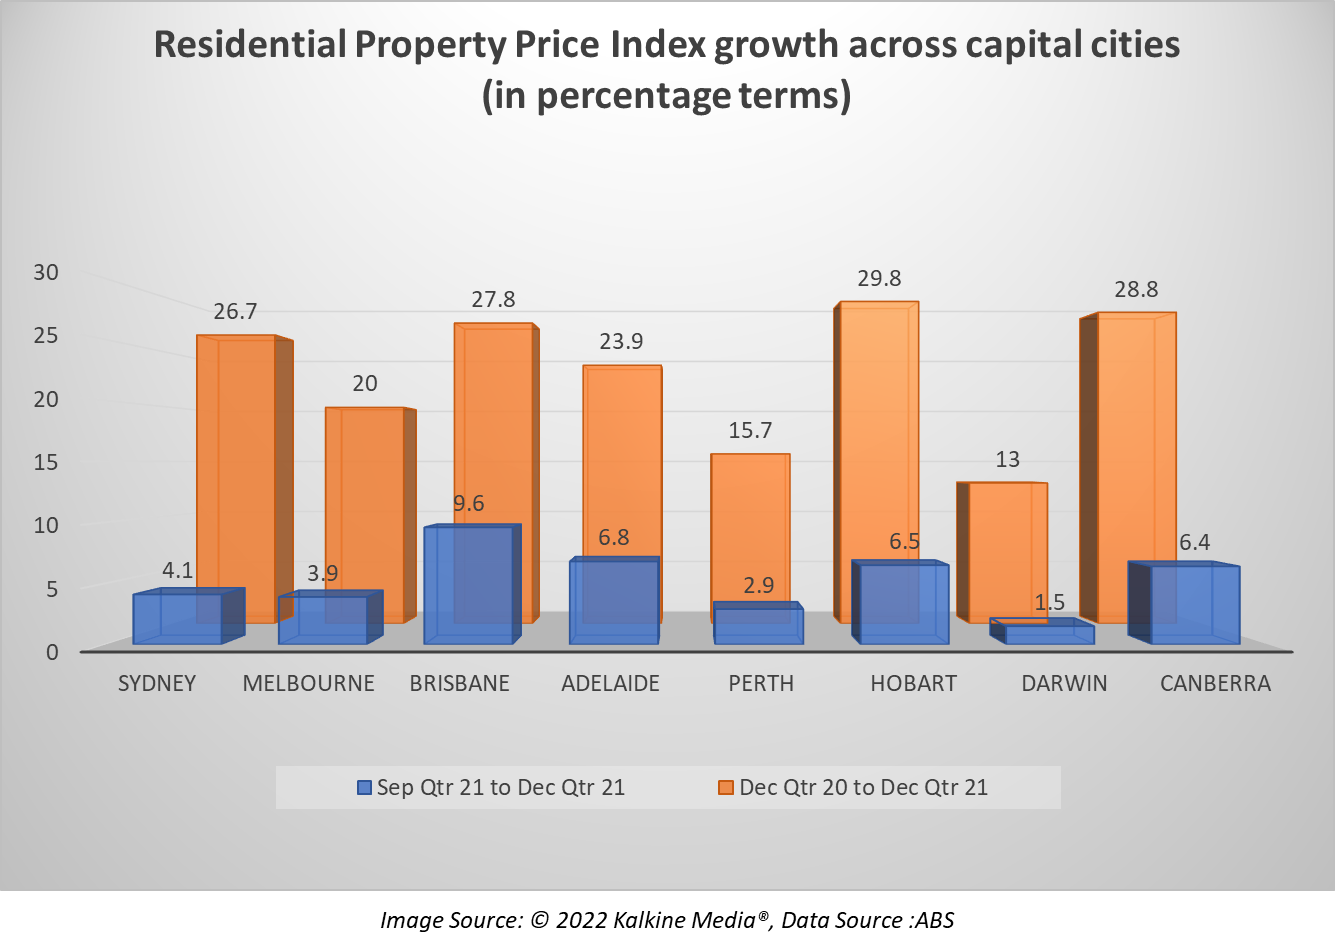
The Residential Property Price Index for all eight capital cities marked an uptick through the 12 months to December 2021. The largest annual rises since the commencement of the series were seen in Hobart (+29.8%), Canberra (+28.8%), Brisbane (+27.8%), Sydney (+26.7%) and Adelaide (+23.9%).
Additionally, Melbourne saw the largest annual rise (+20%) since the June 2010 quarter. The annual rises in Perth and Darwin were slightly lower at 15.7% and 13%, respectively.
2. House price growth outpaces price growth for attached dwellings
Housing prices saw an increase of 27.5% throughout the year. Alternatively, the prices of attached dwellings rose at a lower rate of 14%, signifying an inflated housing value estimation. The total value of Australia’s 10.8 million residential dwellings jumped by AU$512.6 billion to AU$9.9 trillion during the December 2021 quarter.
However, over the entire 12 months to the December quarter, the value of residential dwellings soared by AU$2.015 trillion. Moreover, the mean price of residential dwellings in Australia came in at AU$920,100 in the December 2021 quarter, up from AU$876,100 in the September 2021 quarter.
3. Higher lending in December quarter
During the December 2021 quarter, residential property prices rose 4.7%. The strongest quarterly rise was recorded in Brisbane at 9.6%, followed by Adelaide at 6.8%, Hobart at 6.5% and Canberra at 6.4%.
ABS data suggest that these results arrived in line with the lending indicators data, which also showed an increase during the December 2021 quarter. New lending commitments for housing rose to a record high during the quarter, while sales transaction volumes also recorded an increase.
The December quarter was also marked with a rebound in economic activity as the Delta variant induced restrictions were pulled away gradually during the initial weeks of the quarter.
ALSO READ: Russia-Ukraine conflict: What are economic costs of a war?
