Highlights
- Global supply chain disruptions and soaring inflation have increased market volatility in 2022.
- When the volatility is low, the band squeezes and it expands when volatility starts to increase.
- There are a few technical indicators that help to gauge the market volatility so that investors can make informed decisions.
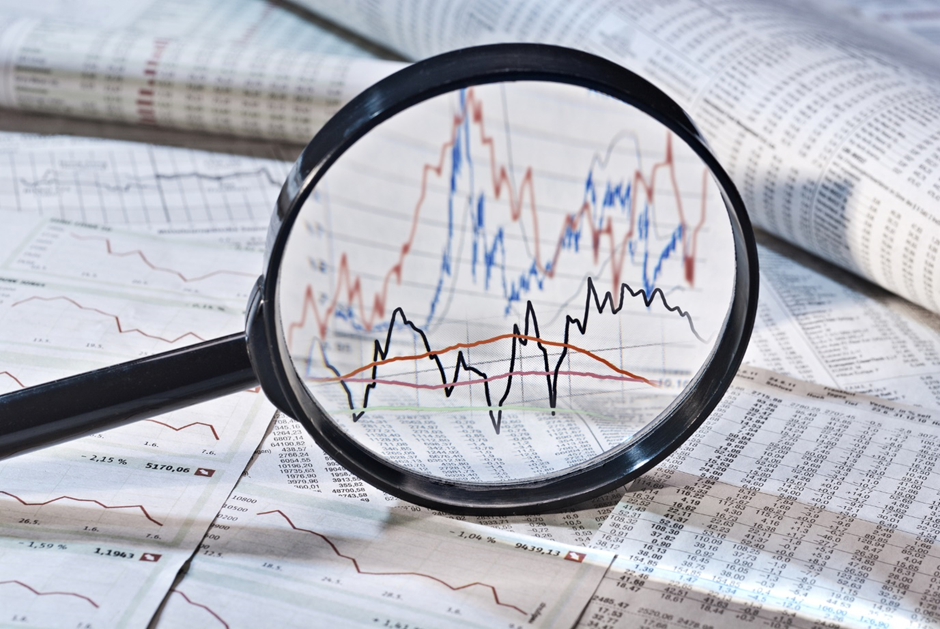
One of the major features of financial markets is volatility, which measures the magnitude of the price movements (in either direction). Russia’s invasion on Ukraine has massively amplified market volatility to its highest level this year. Disruptions in the global supply chain and soaring inflation have sent jitters through the markets, and investors are finding it difficult to navigate through these tough times.

Image Source: © gopixa | Megapixl.com
However, there are a few technical indicators that help to gauge the market volatility so that investors can make informed decisions. Let us have a look at three such indicators.
Read More: How to analyze Bollinger Bands® and Trade Set-Up?
- Volatility index
The volatility index is essentially a quantitative measure of how volatile the broader market is currently. Every major market has its own volatility index that measures the volatility of their respective benchmark indices. For example, the A-VIX measures the volatility of the Australian benchmark ASXX 200 index, whereas the CBOE VIX does the same for S&P 500 index in the US.
Although the calculation of a VIX index is complicated; however, its interpretation is relatively simple. The value of VIX index is an annualised expected move of the benchmark index (on either side), which investors are predicting. Therefore, higher the value of VIX, higher would be the move or volatility that investors are expecting from the underlying index and vice versa.
- Average True Range (ATR)
While a volatility index only calculates the volatility of a benchmark index, the ATR is an indicator which can be applied to any security to gauge its volatility levels, including historic volatility. ATR is a mathematical calculation which computes the daily price movement (can we weekly, monthly, or even intraday) and averages it out over a period of time.
The end number is essentially a representation of the magnitude of price movement of the underlying security over the past multiplied by the number of periods (decided by the user). Higher the reading, higher is the volatility and vice versa.
- Bollinger Bands®
Invented by John Bollinger, Bollinger Bands® has a different way of measuring the volatility of an underlying security. When applied on a chart, it calculates the 2 standard deviation move on both the sides of the 20-period simple moving average of the price and plots the data point on both sides of the price. When joined together, it creates a band-like structure which encompasses the price.
This band is dynamic in nature and reacts to volatility. When the volatility is low, the band squeezes and it expands when volatility starts to increase. This is one of the most popular measures to gauge the volatility of a security due to its easy-to-decipher visual representation.
Bottom Line
Financial markets are not immune to volatility and investors will have to face multiple periods of low and high volatility in their investing journey. However, by using some technical indicators, investors can better plan and optimise their investment strategies.
Watch More: What are Bollinger Bands®?


