


Highlights
- The S&P/TSX Capped Information Technology Index has sunk 33 per cent year-to-date (YTD)
- SHOP is currently down 76 per cent from its 52-week high
- BlackBerry’s stock saw its one-year low of C$7.15 on April 28
The S&P/TSX Capped Information Technology Index has taken a bit of a battering this year. It has sunk 33 per cent year-to-date (YTD).
This raises the question as to whether it might be time to pick up TSX tech stocks on the dip. Tech currently constitutes 5.66 per cent of the S&P/TSX Composite Index.
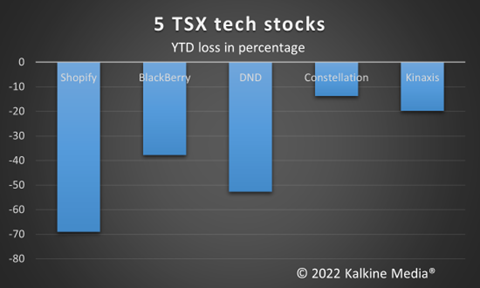
Let us look at five TSX-listed tech stocks that have taken a beating this year.
Shopify Inc (TSX:SHOP)
Shopify’s stock had lost 69 per cent YTD as it closed at C$426.82 Friday, April 29. On November 19, 2021, the stock touched a one-year high of C$1,763.92. So, it is currently down 76 per cent from that price.
SHOP began a surge in April 2020 and in the past few months it has been almost in free fall. Shopify is now back around the range it was in before its pandemic surge and this makes it an interesting stock especially since before the pandemic years, it had been on a comparatively measured but steady ascent.
Shopify has a price-to-earning (P/E) ratio of 18.8. Effectively, the P/E ratio indicates how many dollars you invest to earn a dollar. It is the cost price of the share divided by the earnings per share.
BlackBerry (TSX:BB)
BB’s YTD loss comes in at 39 per cent. It ended Friday at C$7.35. Over the last six months it is down 45 per cent.
The day earlier, April 28, it saw a 52-week low if C$7.15 and is currently only 2.7 per cent above that. In March, when it fell to this range, it did rebound.
BB’s P/E ratio is 197.7, significantly more than that of SHOP.
Also read: SLI, SGML, LI, FL & RCK: 5 TSXV lithium stocks to hold for 5 years
Dye & Durham Limited (TSX:DND)
DND closed Friday at C$21.21 and is down 53 per cent this year. On April 20, it saw a 52-week low of C$20.81 and is currently trading only 1.92 per cent over that.
DND was on a downward trajectory for much of this year so far, but since the second week of April, it seems to have stemmed the fall and has had a relatively flat trajectory since, which raises the question as to whether it may start on a rebound.
The stock has a P/E ratio of 75.8.
Also read: TAL, AFE, PSH, QRC & QUIS: 5 dirt-cheap penny stocks to consider in May
Constellation Software Inc (TSX:CSU)
CSU having lost 14 per cent in 2022 so far, closed at C$2,021 Friday. It is the only stock on this list which is in the green on a 12-month basis, up about 11 per cent.
The stock has reached this price range on multiple occasions this year but hasn’t fallen lower.
It is a C$43 billion market cap company and its P/E ratio is 109.9. It pays a US$1 quarterly dividend for a dividend yield of 0.252 per cent.
Also read: CPG, MEG, PSK, SSRM & TRQ: 5 TSX no-brainer mid cap stocks for March
Kinaxis Inc (TSX:KXS)
The stock of the software solutions provider ended Friday at C$142.16. It is down 20 per cent YTD.
Over the last six months, it has lost 26 per cent. However, it rebounded around three per cent in the last week.
In late February and early march, it was in the current C$140 range but then climbed higher. It remains to be seen if it will extend its rebound over the past week.
Also read: NGEX, CRE, AMX, NFG & AFM: 5 TSXV mining stocks to buy in May?
Bottom line
Like their sector, the above stocks have taken a beating this year; some more than others as the graphic shows. Will May be the year the tech sector pulls a recovery this year?
That remains to be seen. But these aren’t small companies, in fact, they are some of the biggest companies in the S&P/TSX Capped Information Technology Index with billion-dollar market caps. And so, these stocks make for an interesting watch.
Also read: How does current inflation compare to 1970s stagflation?
Please note, the above content constitutes a very preliminary observation based on the industry, and is of limited scope without any in-depth fundamental valuation or technical analysis. Any interest in stocks or sectors should be thoroughly evaluated taking into consideration the associated risks.
