


Summary
- The gaming industry is seeing a remarkable surge in these pandemic times.
- After tumbling during the March market crash, shares of Spin Master soared over 187 per cent in the last six months.
- Spin Master has been ranked among TMX’s Top Consumer Goods stocks that have outperformed its peers across the TSX and TSXV in the last 30 days.
- NVIDA stocks registered a growth of over 124.24 per cent this year.
The gaming industry is seeing a remarkable surge in both revenue and response vis-a-vis outdoor games as COVID 19-related curbs as billions of people stay indoors and explore options of entertainment. But with easing restrictions and industries reopening, will outdoor games restore their pre-pandemic demands and revenue? Or online and indoor gaming’s recent surge is here to stay? To explore this industry further, let us take a look at two game stocks: Spin Master Corp. (TSX:TOY) and NVIDIA Corporation (NASDAQ:NVDA).
Spin Master Corp (TSX:TOY)
Current Stock Price: C$ 28.17
Spin Master is a manufacturer and designer of toys, games, and entertainment products. This kid’s entertainment company is set to acquire London-based Rubik’s Brand Ltd, owner of the iconic Rubik's Cube® puzzle that has enthralled its fans for more than four decades. Spin Master is expanding its gaming business through a series of acquisitions.
Spin Master has been nominated to five of Toy of the Year (TOTY) 2020 categories. It also landed two spots on the UK's DreamToys Top 12 Toy List by the Toy Retailers Association and was awarded “Top Designer Of The Year” and “Top Innovator Of The Year”.
Spin Master Stock Performance
Based in Toronto, Spin Master Corp is up 9.86 per cent in the last three months. Shares of the toy firm recorded a decline of over 28.86 per cent year-to-date. After tumbling during the March market crash, its shares soared over almost 187 per cent in the last six months.
TOY has been ranked among TMX’s Top Consumer Goods stocks that have outperformed its peers in the last 30 days.
The entertainment stock has a current market capitalization of C$ 865.9 million and earnings-per-share (EPS) of 0.38. As per data on TMX, the company’s price-to-earnings (P/E) ratio is 80, and its price-to-book (P/B) ratio is 2.979. The company’s price-to-cashflow (P/CF) ratio is 14. The stock’s return on equity (ROE) is 4.83 per cent and its return on assets (ROA) is 2.71 per cent.
In the second quarter for its fiscal year 2020, Spin Master reported total revenue of US$ 281.1 million, a 12.4 per cent decline compared to US$ 321.0 million.
TOY posted a gross product sale of US$282.2 million in Q2 FY20, a 10.9 per cent fall compared to US$316.8 million in Q2 FY19.
The company reported a low sale in Pre-School & Girls, Boys Action & Construction, and Remote-Control Toys & Interactive Characters were compensated by rises in Activities, Games, Puzzles & Plush, as well as Outdoor.
Spin Master Corp will release its Q3 FY20 earnings on November 11, 2020.
NVIDIA Corporation (NASDAQ:NVDA)
Current Stock Price: US$ 520.96
NVIDIA Corporation is a graphics designing Company providing three-dimensional graphics processors and related software services.
Despite the COVID-19’s impact on the visualization and automotive platforms, the company has rebounded due to its segments on gaming, artificial intelligence, cloud computing, and automation enabled machines.
NVIDIA acquired computer networking product firm Mellanox Technologies in April.
NVIDIA Corp Stock Performance
Based in the United States, NVIDIA Corp is up nearly 22.7 per cent in the last three months. Shares of the 3D graphic firm registered a growth of over 124.24 per cent year-to-date. After plummeting during the March market crash, its shares surged over almost 165.25 per cent in the last six months.
The company has a current market capitalization of C$ 321.8 billion and earnings-per-share (EPS) of 5.44. As per data on TMX, the company’s P/E ratio is 98.5, and its price-to-book (P/B) ratio is 23.79. NVIDIA’s price-to-cashflow (P/CF) ratio is 59.70. The stock’s return on equity (ROE) is 27.21 per cent, and its return on assets (ROA) is 16.57 per cent.
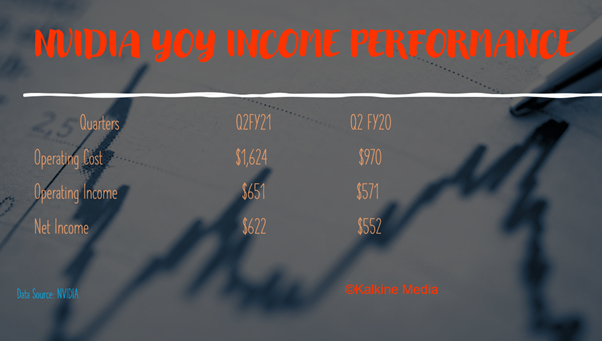
NVIDIA's Net Income Was Up Over 12 Per Cent In Q2 FY21, Year-Over-Year. (Data Source- NVIDIA)
In the second quarter for its fiscal 2021, NVIDIA posted a revenue of US$ 3.87 billion, a 50 per cent surge, compared to US$ 2.58 billion in Q2 FY20, and up 26 percent from US$ 3.08 billion in Q1 FY21. The company’s revenue from Data Centre stood at US$1.75 billion, a 167 per cent surge year-over-year.
Mellanox generated 14 per cent of the company’s revenue growth in the latest quarter.
The company will release its third quarter results in November 18.
