


Summary
- Canadians are investing in ETFs at record levels, bringing inflows of C$ 22 billion in the first half of 2020 – highest in a half-year calendar period in a decade.
- Total of 79 new ETFs have debuted on the TSX in 2020, including 21 in January and 22 in June
- Canadian ETFs attracted net flows of C$ 4 billion in June including equity inflows of C$2.5 billion and fixed income of C$ 1.2 billion
Twenty-two new exchange traded funds (ETFs) debuted on the Toronto Stock Exchange in June 2020 as the Canadian economy actively tries to get out of the COVID-triggered slump with federal boosters. The previous peak was in January 2020 when 21 new issues started trading on the country’s key exchange platform. Reeling under containment measures, April recorded the lowest number with the launch of just four new ETFs.
Some of the new ETFs listed are Horizons USD Cash Maximizer ETF (HSUV.U), Wealthsimple North America Socially Responsible Index ETF (WSRI), and Fidelity Canadian Value Index ETF (FCCV).
A total of 79 new ETFs have debuted on the TSX so far this year:
|
Month |
New ETFs per month |
|
January 2020 |
21 |
|
February 2020 |
14 |
|
March 2020 |
7 |
|
April 2020 |
4 |
|
May 2020 |
11 |
|
June 2020 |
22 |
|
Total |
79 |
The Canadian ETF industry surpassed the C$ 200 billion mark after a total of 100 new ETFs debuted on the TSX last year. The index currently houses over 700 ETFs. Nearly C$ 94 billion of ETF equity was traded in 2019.
Historic levels for Canadian ETFs
Canadians are investing in ETFs at record levels, bringing in inflows of C$ 22 billion in the first half of 2020 – twice the figure from the same period in 2019, and highest ETF money flow in first half of the year (H1) period in 10 years, the National Bank of Canada said in a report.
Following the bear markets of March and April, Canadian ETFs attracted net flows of C$ 4 billion in June as markets stabilized. This includes equity inflows of C$2.5 billion and fixed income of C$ 1.2 billion.
These investments by Canadians presents a remarkable risk appetite in the face of pandemic-induced volatility, said the bank. Two Horizons ETFs accounted for C$ 2.5 billion in capital for the first half of 2020.
However, Canadian active managers underperformed their benchmarks levels, says S&P Global’s SPIVA report. Just a handful fund managers have consistently outperformed their group. The top half of Canadian Equity and Global Equity funds from 2014 to 2016 did not have more than 52 percent chance of staying in the top half from 2017 to 2019, adds the report.
Let’s take a look at the two new ETFs launched in June:
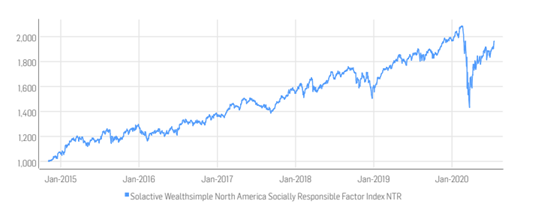
Wealthsimple North America Socially Responsible Index (WSRI) ETF
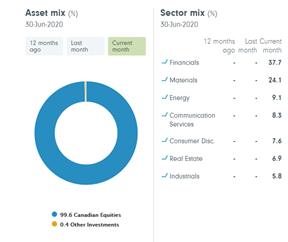
WSRI, launched by robo-advisor Wealthsimple, invests in Canadian and American stocks that firms that meet a certain threshold of social and environmental responsibility. The ETF has a current market cap of C$ 209,280,000 and currently trading at C$ 26.16. It has gained over 4.3 percent since its launch on the TSX on July 18.
Historical Performace of WSRI ETF
Top components of WSRI ETF as of July 16, 2020
|
Company |
Ticker |
Country |
Index Weight (%) |
|
HYDRO ONE LTD |
HCT Equity |
Canada |
4.55% |
|
AGNICO-EAGLE MINES |
AEM CT Equity |
Canada |
4.25% |
|
VULCAN MATERIALS CO |
VMC UN Equity |
United States |
3.67% |
|
CAMECO CORP |
CCO CT Equity |
Canada |
3.42% |
|
D R HORTON INC |
DHI UN Equity |
United States |
3.29% |
|
LKQ CORP |
LKQ UW Equity |
United States |
2.47% |
|
TAKE-TWO INTERACTIVE SOFTWRE |
TTWO UW Equit |
United States |
2.35% |
|
NVR INC |
NVR UN Equity |
United States |
2.22% |
|
CLOROX COMPANY |
CLX UN Equity |
United States |
1.54% |
|
GENERAL MILLS INC |
GIS UN Equity |
United States |
1.33% |
(Image & Table Source: Wealthsimple)
Fidelity Canadian Value Index ETF (FCCV)
As per information on Fidelity Investments site, this EFT has “outcome-oriented approach” providing undervalued securities the opportunity to outperform in the long run. It has total net assets of C$ 2.5 million and charges a management fee of 0.35%.
FCCV’s Allocation
Top components of FCCV ETF as of July 16, 2020
|
Security name |
Market value |
% of net assets |
|
ROYAL BANK OF CANADA |
$197,648.64 |
7.84% |
|
TORONTO DOMINION BANK |
$163,770.00 |
6.50% |
|
BARRICK GOLD CORP |
$158,717.52 |
6.29% |
|
DOLLARAMA INC |
$125,165.15 |
4.96% |
|
BANK OF NOVA SCOTIA |
$105,200.20 |
4.17% |
|
KIRKLAND LAKE GOLD LTD |
$91,555.20 |
3.63% |
|
KINROSS GOLD CORP |
$91,146.25 |
3.62% |
|
ROGERS COMMUNICATIONS INC B |
$88,013.92 |
3.49% |
|
BCE INC |
$84,914.48 |
3.37% |
|
CANADIAN TIRE CORP CLASS A |
$81,538.38 |
3.23% |
|
Total number of holdings |
54 |
|
|
Top ten holdings aggregate |
47.1% |
|
Performance of FCCV on the TSX from 10 June to 16 July
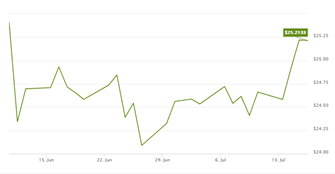
(Image & Table Source: Fidelity Investments)
