


Summary
- The ongoing reporting season is giving insights on how the companies have fared during the tricky situation the world is facing.
- When there is high uncertainty in the market, consistent dividend-paying companies seem to attract various market players, and their results are closely watched.
- Amid the current scenario, companies are finding it extremely hard to continue paying dividends with many players suspending their payouts.
- Wesfarmers Limited reported an 18.8% growth in its FY2020 revenue. However, the total dividend declined to 170 cents.
- Perpetual Limited’s operating revenue dropped by 5% and dividend by 38% in FY2020. CHC’s Operating earnings increased by 46.3% and DPS by 6%.
Financial results have a strong correlation with the share price movement of a Company. Better-than-expected results tend to have a positive impact on the share price, while the prices move south if the results are not as anticipated. In this article, we have considered three S&P/ASX 200 stocks that have released their financial results and have also provided dividend.
Amid COVID-19 crisis, where most companies have either cancelled their dividend or have postponed them, market players are eager to know about a few popular companies that have consistently provided a dividend to its shareholders.
ALSO READ: How Dividends Will Pan-Out for Listed Investment Companies in 2020?
Let us dig into the financial results of these companies and look at their dividend payouts.
Wesfarmers Limited (ASX:WES)
Wesfarmers Limited is amongst Australia's largest listed companies and has diverse business operations which include home development and outdoor living, clothing and general merchandise, office supplies, and an Industrials segment with businesses in chemicals, energy & fertilisers, and industrial & safety products.
On 20 August 2020, the Company announced its FY2020 results for the period ended 30 June 2020.
- Revenue from continuing operations increased by 10.5% to A$30,846 million.
- Net profit for the full-year attributable to members dropped significantly by 69.2% to A$1,697 million.
- Total dividend for the year ended 30 June 2020 was 170 cents. In FY2019, the Company declared total dividend was 278 cents.
Breakdown of Dividend announced in FY2020:
- Interim Dividend: 75 cents
- Final Dividend: 77 cents
- Special Dividend: 18 cents.
Dividend Reinvestment Plan:
Wesfarmers also provides eligible shareholders with an option to invest dividends in ordinary shares which rank equally with Wesfarmers ordinary shares. The last date for receipt of applications to participate in or to terminate or change contribution in the Plan is by 5:00 PM (AWST) on 27 August 2020.
GOOD READ: Popular Dividend Stock with a Target’ed Rational Strategy: Wesfarmers
Stock Information:
By the end of the day’s trade on 21 August 2020, the WES share price settled at A$48.730, down 0.103% from the previous close. WES has a market cap of A$55.31 billion, 1.13 billion outstanding shares, an annual dividend yield of 3.12%, and a PE ratio of 25.280x.
Wesfarmers shares, in the last six months, have delivered a return of 3.92% while in the previous three months, the shares provided a return of 25.33%.
ALSO READ: Dividend story of three ASX-listed diversified companies - SSM, CEN and WES
Perpetual Limited (ASX:PPT)
Perpetual Limited is an independent Australian diversified financial services company that operates in Australia, Singapore and the US and offers asset management, financial advice, and trustee services.
On 20 August 2020, the Company announced its FY2020. Let us peek into the financial results:
- Operating revenue dropped by 5% to A$489.2 million.
- Underlying profit before tax decreased by 18% to A$132.3 million.
- Net profit after tax also slipped by 29% to A$82 million.
- Underlying profit after tax margin, which was 32% in FY2019 decreased to 27%.
- Diluted earnings per share on NPA declined 30% to A$172.8 million.
- The Company declared a fully franked dividend of 155 cents per share, down 38% from the previous corresponding year.
The drop in the underlying NPAT was due to:
- A fall in the average funds under management within Perpetual Investments and was driven by net outflows and the effect of prior period distributions.
- There was a drop in non-market revenues in Perpetual Private, which was influenced by the economic slow-down in 2H20 and the low-interest-rate environment.
- PPT continued investment in growth initiatives.
- It was slightly counterbalanced by:
- Higher average equity markets.
- Growth in average funds under advice within perpetual private.
- Benefits from the operating model evaluation
- Progress within all business lines in perpetual corporate trust.
Shareholder Returns and Dividend:
The final dividend for FY2020 is 50 cents per share and would be paid on 25 September 2020. The Dividend Reinvestment Plan would be operational for the final dividend. There would be no discount, and the DRP will be met by issuing new shares.
DO READ: Investment Management Stocks on ASX: PNI, PPT, JHG
Stock Information:
By the end of the day’s trade on 21 August 2020, the PPT share price was down 0.063% and settled at A$31.880. PPT has a market cap of A$1.75 billion, around 54.81 million outstanding shares, an annual dividend yield of 4.86% and a PE ratio of 18.09x.
PPT shares, in the last six months, delivered a negative return of 32.52% and a return of 4.25% in the previous three months.
Charter Hall Group (ASX:CHC)
With over 30 years’ experience in property investment and funds management, Charter Hall Group is amongst the top fully integrated property groups in Australia.
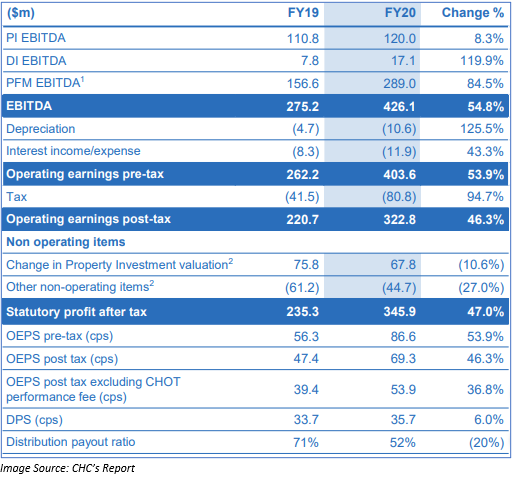
On 20 August 2020, Charter Hall Group announced FY2020 results for the period ended 30 June 2020.
- Operating earnings increased by 46.3% to A$322.8 million.
- Statutory NPAT increased by 47% to A$345.9 million.
- Distribution for the period announced by the Company was 35.7 cents per share, up 6% as compared to the previous corresponding period.
- Total Platform Return during FY2020 was 18.8%.
- DPS grew by 6% to 35.7 cents per share.
Operational Highlights:
- During the period, A$5.1 billion of gross equity raised and A$4.6 billion of net inflows generated by the Company.
- Deployed A$8.3 billion of gross transactions.
- FUM by the end of FY2020 stood at A$40.5 billion with A$1.3 billion of FUM growth post-balance date to take FUM to A$41.8 billion.
- Property investment was up A$184 million to A$2 billion providing a 10% return for the year.
INTERESTING READ: S&P/ASX 200 A- REIT Attempts Volatility Breakout – GMG, CHC, and DXS
Stock Information:
By the end of the day’s trade on 21 August 2020, CHC share price was up 2.417% and settled at A$12.290. CHC has a market cap of A$5.59 billion, around 465.78 million outstanding shares, an annual dividend yield of 2.98%, and a PE ratio of 13.480x.
CHC shares, in the last six months, have provided a negative return of 13.67% and delivered impressive growth of nearly 40.35% in the previous three months.
DID YOU KNOW: Charter Hall Sells 5% Holding in Waypoint REIT
