


Highlights
- Altech Batteries Limited, formerly Altech Chemicals Limited, is an Australia-based speciality battery materials technology company.
- ATC shares rallied nearly 10% on 14 April 2023, after the company shared a progress update on its Silumina Anodes Pilot Plant in Saxony, Germany.
- The stock is up over 100% in the last nine months.
Speciality battery materials technology company Altech Batteries Limited (ASX:ATC), which is on its way to commercialising the CERENERGY battery project, has been witnessing buying interest over the last few days. ATC shares have gained over 28% in the last one month and have rallied over 100% in the previous 9-month time frame.
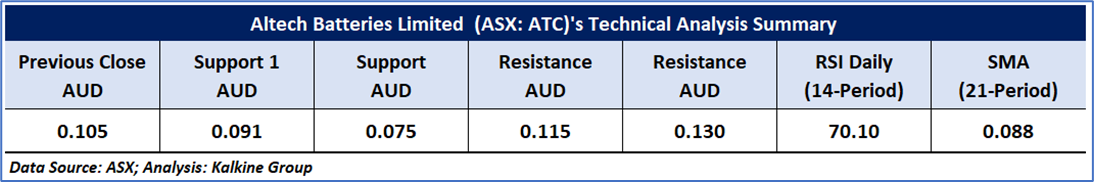
Despite this recent up move, the stock is still 21% away from its previous 52-week high of AU$ 0.130 clocked on 20 September 2022.
On 14 April 2023, ATC shares gained nearly 10% after the company shared a progress update on its Silumina Anodes Pilot Plant in Saxony, Germany and the Definitive Feasibility Study for the planned Silumina AnodesTM 10,000tpa plant.
As per the company, it made significant progress in incorporating high-capacity, high-purity alumina-coated silicon and graphite in lithium-ion batteries. The company has commenced construction of a pilot plant adjacent to the proposed project site to facilitate the qualification process for its Silumina AnodesTM product as it races to bring its patented technology to market as soon as possible.
Given these latest updates, let's do an analysis of ATC technical charts to find out where the stock is heading.
ATC’s Technical Analysis:
As per the charts given below, ATC's stock price has established a symmetrical triangle formation on the daily chart and currently facing resistance from the upper band of the pattern. Furthermore, with a reading of 70.10, the RSI (14-period) has entered the overbought zone, which shows further upside in the stock may be capped. However, prices are trading above the trend-following indicators 21-period and 50-period SMAs, which might serve as support levels for the stock. The stock's key support level is AUD 0.091, while the main resistance level is AUD 0.115.
Daily Technical Chart – ATC

The stock was analysed as per the closing price of AUD 0.105 per share as on 13 April 2023, up by ~5.00%.
Disclosure: Altech Batteries Limited (Company) is a client of Kalkine Media Pty Ltd (Kalkine Media), an affiliate of Kalkine. However, under no circumstances have Kalkine or its related entities been, directly or indirectly influenced in making any related insights concerning the company as contained in this report, and no form of compensation is or will be received by Kalkine, Kalkine Media or Kalkine's other related entities for the publication of this report.
Note 1: Past performance is neither an Indicator nor a guarantee of future performance.
Technical Indicators Defined:
Support: A level at which the stock prices tend to find support if they are falling, and a downtrend may take a pause backed by demand or buying interest. Support 1 refers to the nearby support level for the stock and if the price breaches the level, then Support 2 may act as the crucial support level for the stock.
Resistance: A level at which the stock prices tend to find resistance when they are rising, and an uptrend may take a pause due to profit booking or selling interest. Resistance 1 refers to the nearby resistance level for the stock and if the price surpasses the level, then Resistance 2 may act as the crucial resistance level for the stock.
Stop-loss: It is a level to protect further losses in case of unfavourable movement in the stock prices.
The Green colour line reflects the 21-period moving average. SMA helps to identify existing price trends. If the prices are trading above the 21-period, prices are currently in a bullish trend (Vice – Versa).
The Blue colour line reflects the 50-period moving average. SMA helps to identify existing price trends. If the prices are trading above the 50-period, prices are currently in a bullish trend (Vice – Versa).
The Orange/ Yellow colour line represents the Trendline.
The Purple colour line in the chart’s lower segment reflects the Relative Strength Index (14-Period), which indicates price momentum and signals momentum in trend. A reading of 70 or above suggests overbought status, while a reading of 30 or below suggests an oversold status.
Disclaimer
This article has been prepared by Kalkine Media, echoed on the website kalkinemedia.com/au and associated pages, based on the information obtained and collated from the subscription reports prepared by Kalkine Pty. Ltd. [ABN 34 154 808 312; AFSL no. 425376] on Kalkine.com.au (and associated pages). The principal purpose of the content is to provide factual information only for educational purposes. None of the content in this article, including any news, quotes, information, data, text, reports, ratings, opinions, images, photos, graphics, graphs, charts, animations, and video is or is intended to be, advisory in nature. The content does not contain or imply any recommendation or opinion intended to influence your financial decisions, including but not limited to, in respect of any particular security, transaction, or investment strategy, and must not be relied upon by you as such. The content is provided without any express or implied warranties of any kind. Kalkine Media, and its related bodies corporate, agents, and employees (Kalkine Group) cannot and do not warrant the accuracy, completeness, timeliness, merchantability, or fitness for a particular purpose of the content or the website, and to the extent permitted by law, Kalkine Group hereby disclaims any and all such express or implied warranties. Kalkine Group shall NOT be held liable for any investment or trading losses you may incur by using the information shared on our website.
