


Highlights
- Megaport Limited (ASX:MP1) provides network service solutions through software-defined networking
- Last week on 11 July 2023, the company upgraded its EBITDA guidance for FY23 and FY24 because of a continued improvement in its operating metrics
- MP1 shares have advanced nearly 117% in the last three months
Megaport Limited (ASX:MP1), which provides network service solutions through software-defined networking, today announced that it would report its earnings for the Q4FY23 on Thursday, 27 July 2023, before the market opening. This will be followed by a short presentation by the company's CEO at 10:30 am AEST. MP1 shares today closed 1.06% higher at AUD 9.540.
Last week on 11 July 2023, the company upgraded its EBITDA guidance for FY23 and FY24 because of a continued improvement in its operating metrics and financial performance. The company said its normalised EBITDA for FY23 is now expected to be in the range of AUD 19mn- AUD 21mn compared to its previous guidance of AUD 16mn- AUD 18mn. Megaport also said it was net cash positive in the fourth quarter of FY23, including redundancy payments of nearly AUD 2.6mn.
For FY24, the company said its EBITDA could be AUD 41mn-AUD 46mn, higher than the guidance shared earlier. The company will provide detailed guidance for FY24 at the time of the release of its FY23 full year results on 22 August 2023.
Following the announcement of this update on 11 July, MP1 shares rallied nearly 34%. Worth mentioning here is that MP1 shares have advanced nearly 117% in the last three months. Will the stock continue its upward journey in the near future? Let's study the price chart of MP1 to get clues about the near-term direction of the stock.
MP1’s Technical Analysis:
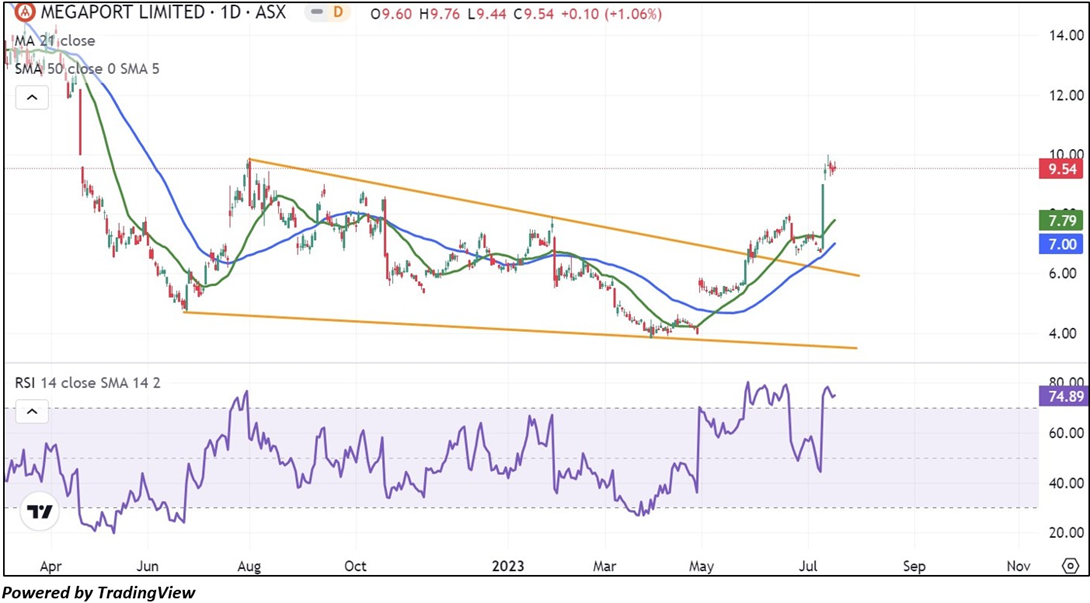
MP1's stock price has been displaying a short-term upward trend characterised by higher peaks and higher lows after surpassing the upper band of a falling wedge pattern in late May 2023, indicating a positive bias. The RSI (14-period) is moving in a positive zone, further reinforcing the previous observation. Currently, the stock's prices are trading above both the 21-period and 50-day SMAs, which may serve as dynamic support levels. In contrast, the stock's most recent high might act as a resistance level. Crucial support for the stock is at AUD 7.90, while significant resistance is at AUD 10.49.
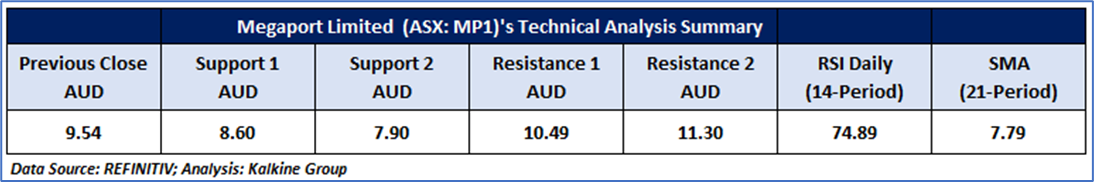
Daily Technical Chart – MP1
The technical levels for the stock were evaluated as per the closing price of AUD 9.54 per share, up 1.06%, as on 18 July 2023.
Note 1: Past performance is neither an Indicator nor a guarantee of future performance.
Technical Indicators Defined:
Support: A level at which the stock prices tend to find support if they are falling, and a downtrend may take a pause backed by demand or buying interest. Support 1 refers to the nearby support level for the stock, and if the price breaches the level, then Support 2 may act as the crucial support level for the stock.
Resistance: A level at which the stock prices tend to find resistance when they are rising, and an uptrend may take a pause due to profit booking or selling interest. Resistance 1 refers to the nearby resistance level for the stock and if the price surpasses the level, then Resistance 2 may act as the crucial resistance level for the stock.
Stop-loss: It is a level to protect further losses in case of unfavourable movement in the stock prices.
The Green colour line reflects the 21-period moving average. SMA helps to identify existing price trends. If the prices are trading above the 21-period, prices are currently in a bullish trend (Vice – Versa).
The Blue colour line reflects the 50-period moving average. SMA helps to identify existing price trends. If the prices are trading above the 50-period, prices are currently in a bullish trend (Vice – Versa).
The Orange/ Yellow colour line represents the Trendline.
The Purple colour line in the chart’s lower segment reflects the Relative Strength Index (14-Period), which indicates price momentum and signals momentum in trend. A reading of 70 or above suggests overbought status, while a reading of 30 or below suggests an oversold status.
Disclaimer
This article has been prepared by Kalkine Media, echoed on the website kalkinemedia.com/au and associated pages, based on the information obtained and collated from the subscription reports prepared by Kalkine Pty. Ltd. [ABN 34 154 808 312; AFSL no. 425376] on Kalkine.com.au (and associated pages). The principal purpose of the content is to provide factual information only for educational purposes. None of the content in this article, including any news, quotes, information, data, text, reports, ratings, opinions, images, photos, graphics, graphs, charts, animations, and video is or is intended to be, advisory in nature. The content does not contain or imply any recommendation or opinion intended to influence your financial decisions, including but not limited to, in respect of any particular security, transaction, or investment strategy, and must not be relied upon by you as such. The content is provided without any express or implied warranties of any kind. Kalkine Media, and its related bodies corporate, agents, and employees (Kalkine Group) cannot and do not warrant the accuracy, completeness, timeliness, merchantability, or fitness for a particular purpose of the content or the website, and to the extent permitted by law, Kalkine Group hereby disclaims any and all such express or implied warranties. Kalkine Group shall NOT be held liable for any investment or trading losses you may incur by using the information shared on our website.
