


Highlights
- Weebit Nano (ASX:WBT) shares have gained over 160% in the last one year.
- On 10 March 2023, WBT shares hit a 52-week high of AUD 9.030
- Between 10 March and 27 March this year, WBT shares corrected almost 50%.
Weebit Nano (ASX:WBT) shares ended 7.5% higher at AUD 6.890 on Friday, 5 May 2023. Including today's gains, WBT shares have rallied nearly 30% this week. As of today, shares of this technology company are up nearly 162% in the last one year.
This memory chip manufacturer's shares corrected almost 50% in just 11 trading sessions after hitting a 52-week high of AUD 9.030 on 10 March 2023. This led to the belief that the dream run in Weebit shares has come to an end. However, looking at the gain this week, it seems as if the stock has regained its momentum.
In its Q3FY23 activities report published on 26 April 2023, the company said its first ReRAM module is now commercially available in SkyWater Technology's S130 process, and it was under discussion with leading foundries and integrated device manufacturers to commercially manufacturer the ReRAM, which is based on cost-effective non-volatile memory (NVM) technology.
As per the company, ReRAM will replace flash and other alternatives in advanced applications and process nodes and is more efficient and consumes less energy.
In March, WBT shares were added to the S&P/ASX 300 and MSCI Australia Indices, which gave further legs to the ongoing rally in the stock in March. Given this backdrop, can WBT shares resume their dream run again? Let's study the stock's price chart to get some cues about the stocks near-term movement.
WBT’s Technical Analysis:
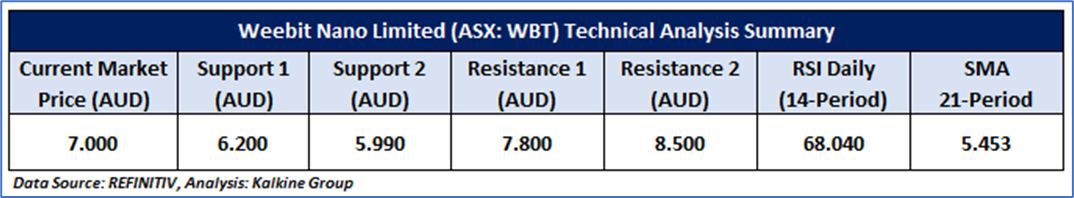
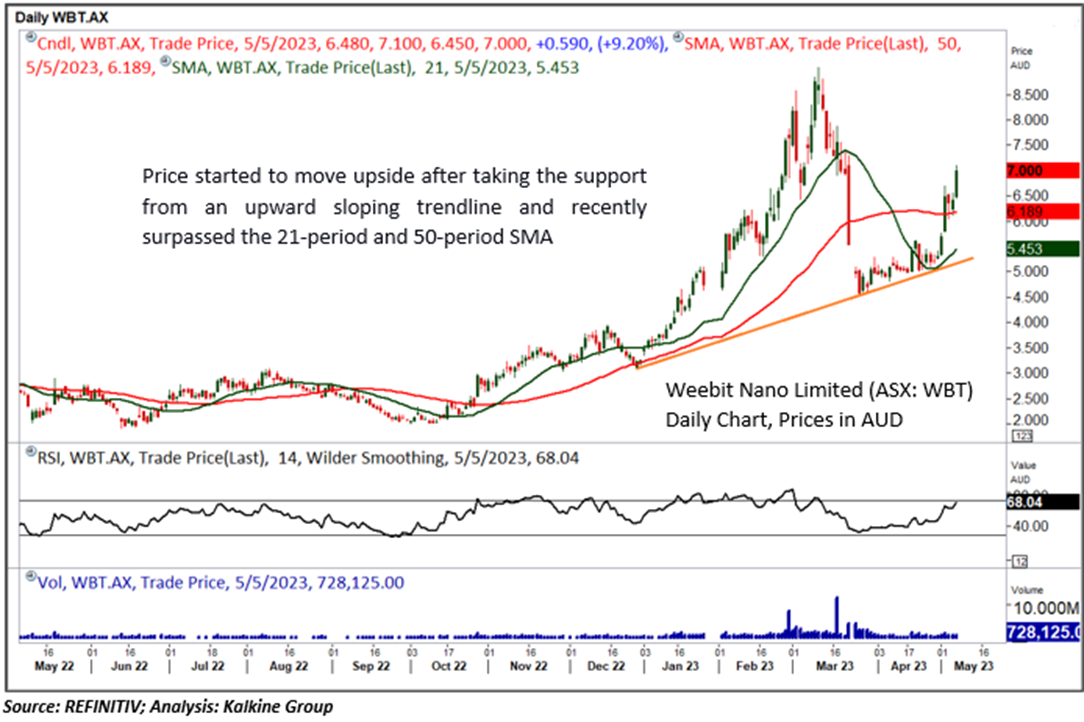
WBT's price started to move upside after taking the support from an upward-sloping trendline and recently surpassed the 21-period and 50-period SMA, indicating the possibility of further upside movement from hereon. Furthermore, RSI (14-period) is moving northward with a reading of 68.04, supporting a positive bias. Important support for the stock is positioned at AUD 5.990, while key resistance is placed at AUD 7.800.
Daily Technical Chart – WBT
The technical levels for the stock were evaluated as per the current market price of AUD 7.000 per share at 12:17 PM AEST on 05 May 2023.
Note 1: Past performance is neither an Indicator nor a guarantee of future performance.
Technical Indicators Defined:
Support: A level at which the stock prices tend to find support if they are falling, and a downtrend may take a pause backed by demand or buying interest. Support 1 refers to the nearby support level for the stock, and if the price breaches the level, then Support 2 may act as the crucial support level for the stock.
Resistance: A level at which the stock prices tend to find resistance when they are rising, and an uptrend may take a pause due to profit booking or selling interest. Resistance 1 refers to the nearby resistance level for the stock and if the price surpasses the level, then Resistance 2 may act as the crucial resistance level for the stock.
Stop-loss: It is a level to protect further losses in case of unfavourable movement in the stock prices.
The Green colour line reflects the 21-period moving average. SMA helps to identify existing price trends. If the prices are trading above the 21-period, prices are currently in a bullish trend (Vice – Versa).
The Blue colour line reflects the 50-period moving average. SMA helps to identify existing price trends. If the prices are trading above the 50-period, prices are currently in a bullish trend (Vice – Versa).
The Orange/ Yellow colour line represents the Trendline.
The Purple colour line in the chart’s lower segment reflects the Relative Strength Index (14-Period), which indicates price momentum and signals momentum in trend. A reading of 70 or above suggests overbought status, while a reading of 30 or below suggests an oversold status.
Disclaimer
This article has been prepared by Kalkine Media, echoed on the website kalkinemedia.com/au and associated pages, based on the information obtained and collated from the subscription reports prepared by Kalkine Pty. Ltd. [ABN 34 154 808 312; AFSL no. 425376] on Kalkine.com.au (and associated pages). The principal purpose of the content is to provide factual information only for educational purposes. None of the content in this article, including any news, quotes, information, data, text, reports, ratings, opinions, images, photos, graphics, graphs, charts, animations, and video is or is intended to be, advisory in nature. The content does not contain or imply any recommendation or opinion intended to influence your financial decisions, including but not limited to, in respect of any particular security, transaction, or investment strategy, and must not be relied upon by you as such. The content is provided without any express or implied warranties of any kind. Kalkine Media, and its related bodies corporate, agents, and employees (Kalkine Group) cannot and do not warrant the accuracy, completeness, timeliness, merchantability, or fitness for a particular purpose of the content or the website, and to the extent permitted by law, Kalkine Group hereby disclaims any and all such express or implied warranties. Kalkine Group shall NOT be held liable for any investment or trading losses you may incur by using the information shared on our website.
