


Highlights
- Telix Pharmaceuticals is a radiopharmaceutical company focusing on the development of diagnostic and therapeutic radiopharmaceutical products
- For its Q1FY23, ended 31 March 2023, the company reported a revenue of AUD 100.1mn, up 27% quarter on quarter
- TLX shares have surged 77.44% amid various positive developments with the company
Shares of Telix Pharmaceuticals Limited (ASX:TLX), which develops radiopharmaceutical products for the treatment of cancer, have been on an uptrend since the beginning of this year. On Thursday (13 July 2023) the stock closed 1.17% higher at AUD 11.250 apiece. On a year-to-date basis, TLX shares are up 54.75%, and in the last six months, the pharmaceuticals stock has surged 77.44% amid various positive developments with the company.
For its Q1FY23, ended 31 March 2023, the company reported a revenue of AUD 100.1mn, up 27% quarter on quarter, driven by global sales of Illuccix®, Telix’s prostate cancer imaging agent. Its cash flow from operations was positive and stood at AUD 2.4mn for the March quarter, showing an improvement of AUD 0.8mn over the December quarter. The company is set to report its quarterly report for the period ended 30 June 2023 on 19 July 2023 at market close.
Last month on 21 June, TLX announced that it had inked a deal to acquire Lightpoint Medical and its SENSEI® radio-guided surgery business for a purchase consideration of USD 20mn upfront and a further USD 15mn earn-out in order to expand into other urologic and non-urologic malignancies. As per the company, this acquisition is likely to add to its artificial intelligence (AI) program, as the former has innovative capabilities in AI for surgical guidance. Following this announcement on 21 June, TLX share closed with nearly 6% gains.
Let's now study the technical chart of TLX shares to understand their possible near term movement.
TLX’s Technical Analysis:
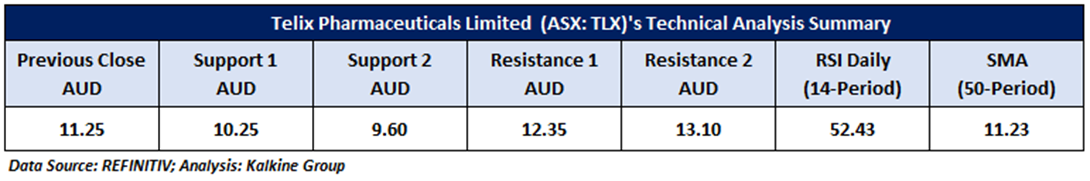
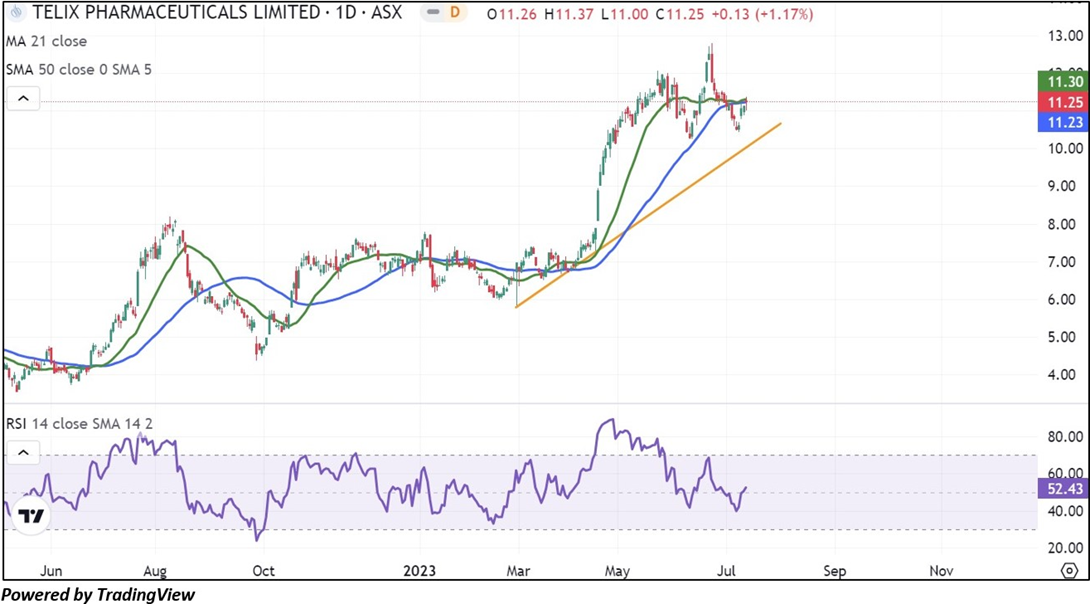
TLX share price is showing an upward trend characterized by consistently higher highs and higher lows. Despite a minor correction at present, TLX is backed by a short-term support trendline that has been established since February 28, 2023, indicating that the stock's upward trend remains intact. Additionally, both stock price and the 21-period SMA are trading above the 50-period SMA, which supports a positive bias. The RSI (14-period) is also moving above the midpoint with a reading of 52.43. Important support for the stock is located at AUD 10.25, while key resistance is situated at AUD 12.35.
Daily Technical Chart – TLX
The technical levels for the stock were evaluated as per the closing price of AUD 11.250 per share, up 1.17%, as on 13 July 2023.
Note 1: Past performance is neither an Indicator nor a guarantee of future performance.
Technical Indicators Defined:
Support: A level at which the stock prices tend to find support if they are falling, and a downtrend may take a pause backed by demand or buying interest. Support 1 refers to the nearby support level for the stock, and if the price breaches the level, then Support 2 may act as the crucial support level for the stock.
Resistance: A level at which the stock prices tend to find resistance when they are rising, and an uptrend may take a pause due to profit booking or selling interest. Resistance 1 refers to the nearby resistance level for the stock and if the price surpasses the level, then Resistance 2 may act as the crucial resistance level for the stock.
Stop-loss: It is a level to protect further losses in case of unfavourable movement in the stock prices.
The Green colour line reflects the 21-period moving average. SMA helps to identify existing price trends. If the prices are trading above the 21-period, prices are currently in a bullish trend (Vice – Versa).
The Blue colour line reflects the 50-period moving average. SMA helps to identify existing price trends. If the prices are trading above the 50-period, prices are currently in a bullish trend (Vice – Versa).
The Orange/ Yellow colour line represents the Trendline.
The Purple colour line in the chart’s lower segment reflects the Relative Strength Index (14-Period), which indicates price momentum and signals momentum in trend. A reading of 70 or above suggests overbought status, while a reading of 30 or below suggests an oversold status.
Disclaimer
This article has been prepared by Kalkine Media, echoed on the website kalkinemedia.com/au and associated pages, based on the information obtained and collated from the subscription reports prepared by Kalkine Pty. Ltd. [ABN 34 154 808 312; AFSL no. 425376] on Kalkine.com.au (and associated pages). The principal purpose of the content is to provide factual information only for educational purposes. None of the content in this article, including any news, quotes, information, data, text, reports, ratings, opinions, images, photos, graphics, graphs, charts, animations, and video is or is intended to be, advisory in nature. The content does not contain or imply any recommendation or opinion intended to influence your financial decisions, including but not limited to, in respect of any particular security, transaction, or investment strategy, and must not be relied upon by you as such. The content is provided without any express or implied warranties of any kind. Kalkine Media, and its related bodies corporate, agents, and employees (Kalkine Group) cannot and do not warrant the accuracy, completeness, timeliness, merchantability, or fitness for a particular purpose of the content or the website, and to the extent permitted by law, Kalkine Group hereby disclaims any and all such express or implied warranties. Kalkine Group shall NOT be held liable for any investment or trading losses you may incur by using the information shared on our website.
