


_06_30_2026_08_16_12_076611.png)


Highlights
- MIN reported revenues of AUD 2,290 million for 1HFY25, marking an 8.95% YoY drop, primarily due to lower commodity prices despite stable mining services earnings
- The company's total assets surged by 14.31% YoY to AUD 12,521 million in 1HFY25
Mineral Resources Limited (ASX:MIN) is a diversified ASX-listed resources company operating in lithium, iron ore, energy, and mining services. In the first half of the fiscal year 2025 (1HFY25), MIN reported revenues of AUD 2,290 million, an 8.95% YoY decline from AUD 2,515 million in 1HFY24. The decline was largely attributed to lower commodity prices, although mining services earnings provided some offset as Onslow Iron ramped up production.
Despite lower revenues, the company recorded a 14.31% YoY increase in total assets, reaching AUD 12,521 million by the end of the period, compared to AUD 10,953.7 million in 1HFY24. This growth was driven by higher receivables, contract assets, and increased non-current assets, including property, plant, and equipment.
Recent Business Updates
On 18 March 2025, MIN announced that Citigroup Global Markets Limited had reduced its stake in the company from 9.2072% to 7.8267%.
On 7 March 2025, S&P Dow Jones Indices declared that MIN would be removed from the S&P/ASX 50 Index, effective 24 March 2025.
Key positives and negatives
In 1HFY25, the company saw finance income rise to AUD 36 million, up from AUD 29 million in 1HFY24, and non-current assets grew to AUD 9,994 million by 31 December 2024, compared to AUD 9,592 million in June 2024.
However, MIN faced setbacks, including a decline in EBITDA margin to 11.0% in 1HFY25, a significant drop from 24.7% in 1HFY24 and asset turnover weakened from 0.26x to 0.19x.
Outlook
The company remains cautiously optimistic about its mining services segment, projecting production volumes between 280 and 300 million tonnes in FY25. However, attributable volume guidance for Onslow Iron Ore has been lowered to 8.8 – 9.3 million tonnes.
Share performance of MIN
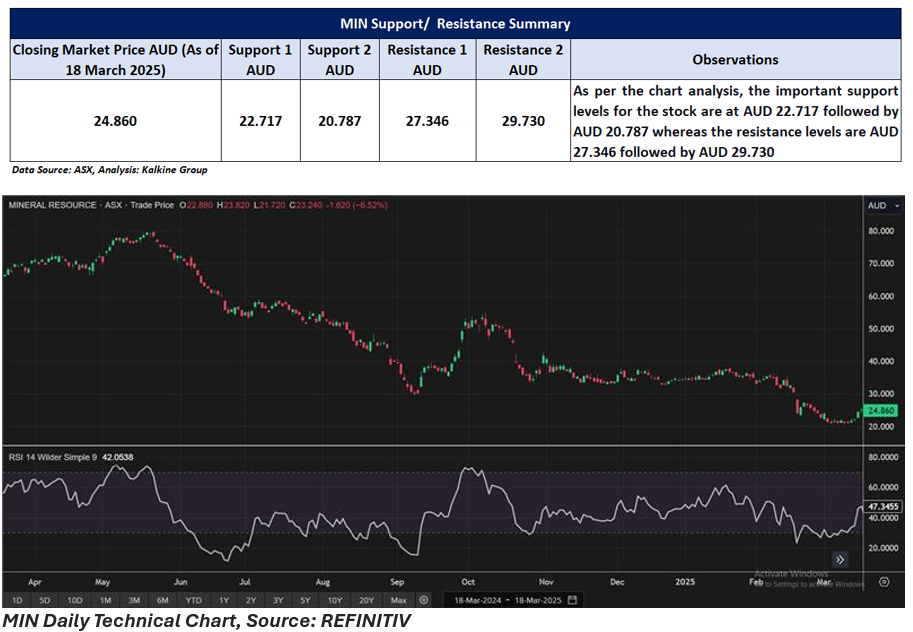
MIN shares closed at AUD 24.86 per share on 18 March 2025. Over the past year, MIN’s share price has dropped by almost 62% and in last six months, it has recorded a drop of 34.30%.
52-week high of MIN is AUD 79.76, recorded on 22 May 2024 and 52-week low is AUD 20.58, recorded on 11 March 2025.
Support and Resistance Summary
Note 1: Past performance is neither an Indicator nor a guarantee of future performance.
Note 2: The reference date for all price data, and currency, is 18 March 2025. The reference data in this report has been partly sourced from EODHD/Others.
Technical Indicators Defined:
Support: A level at which the stock prices tend to find support if they are falling, and a downtrend may take a pause backed by demand or buying interest. Support 1 refers to the nearby support level for the stock and if the price breaches the level, then Support 2 may act as the crucial support level for the stock.
Resistance: A level at which the stock prices tend to find resistance when they are rising, and an uptrend may take a pause due to profit booking or selling interest. Resistance 1 refers to the nearby resistance level for the stock and if the price surpasses the level, then Resistance 2 may act as the crucial resistance level for the stock.
Disclaimer
This article has been prepared by Kalkine Media, echoed on the website kalkinemedia.com/au and associated pages, based on the information obtained and collated from the subscription reports prepared by Kalkine Pty. Ltd. [ABN 34 154 808 312; AFSL no. 425376] on Kalkine.com.au (and associated pages). The principal purpose of the content is to provide factual information only for educational purposes. None of the content in this article, including any news, quotes, information, data, text, reports, ratings, opinions, images, photos, graphics, graphs, charts, animations, and video is or is intended to be, advisory in nature. The content does not contain or imply any recommendation or opinion intended to influence your financial decisions, including but not limited to, in respect of any particular security, transaction, or investment strategy, and must not be relied upon by you as such. The content is provided without any express or implied warranties of any kind. Kalkine Media, and its related bodies corporate, agents, and employees (Kalkine Group) cannot and do not warrant the accuracy, completeness, timeliness, merchantability, or fitness for a particular purpose of the content or the website, and to the extent permitted by law, Kalkine Group hereby disclaims any and all such express or implied warranties. Kalkine Group shall NOT be held liable for any investment or trading losses you may incur by using the information shared on our website.
