
_06_16_2026_04_54_27_535266.jpg)


Highlights
- Lumos Diagnostics specialises in rapid and point-of-care diagnostic technology
- LDX’s share price surged by 311.11% in the last three months
- The company has received US FDA clearance for its FebriDx rapid, point-of-care test
Lumos Diagnostics Holdings Limited (ASX:LDX) is an ASX-listed healthcare equipment and services company that specialises in cost-effective, rapid and point-of-care diagnostic technology to assist professionals in managing and diagnosing medical conditions. The company also offers customised assay manufacturing and development services for POC tests and proprietary digital reader platforms.
LDX’s share price surged by 311.11% over the past three months, and the stocks recorded a rise of 39.62% in the past one week. Today (11 August 2023), the stock gained 23.33% to close at AUD 0.074 apiece, although the company shared no significant update. The stock is sitting on a gain of over 570% quarter till date (QTD).
However, yesterday (10 August 2023), LDX informed that it has received a refund of around AUD 0.7 million related to its R&D tax incentive for the financial year 2022. The fund is related to the research and development activities undertaken by the company for the development and optimisation of the reader technology platform that assists in the reading and interpretation of point-of-care diagnostic test results.
In another update, Lumos Diagnostic informed that it has completed early redemption of all outstanding convertible notes which were issued to SBC Global Investment Fund and Lind Global Fund II.
Through ASX filing dated 3 July, the company had shared that it received US Food and Drug Administration (FDA) clearance for FebriDx rapid, point-of-care test. With the approval, FebriDx can now be marketed in the US. Following the update, Lumos shares zoomed by a whopping 563.63% on 3 July and by another 112.32% on 4 July 2023.
LDX’s Technical Analysis:
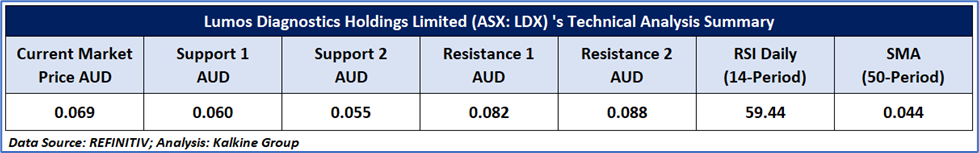
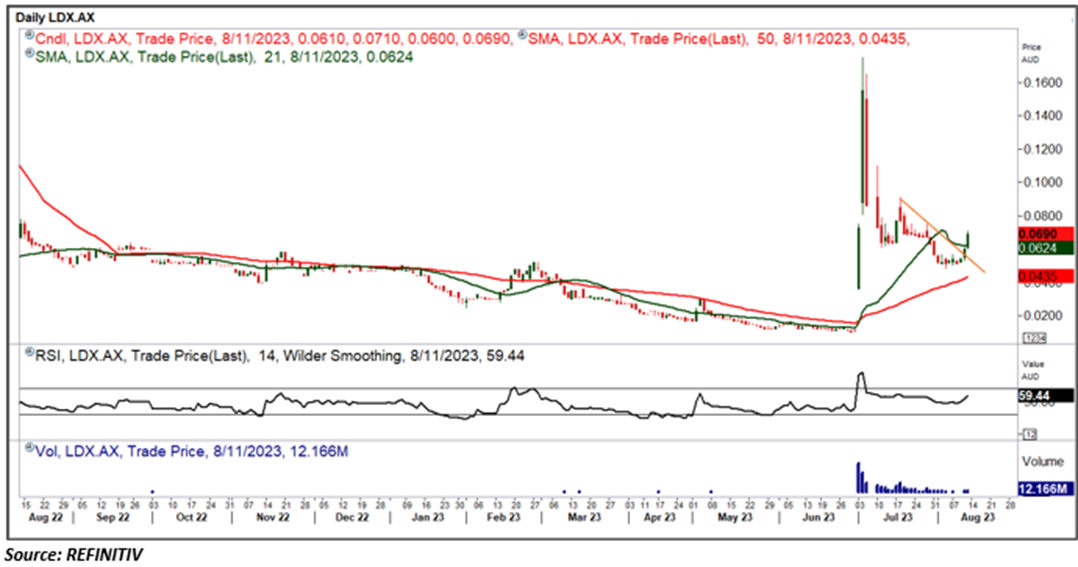
On the daily chart, LDX’s price recently broke a short-term falling trend line by the upside with the support of volumes, indicating the possibility of further upside movement hereon. The leading indicator RSI (14-period) is moving north from the midpoint, further supporting the positive bias. The trend-following indicators, 21-day and 50-day SMAs are below the current market price (CMP) and may serve as the dynamic support levels for the stock. Significant support for the stock is positioned at AUD 0.060, while key resistance is placed at AUD 0.082.
Daily Technical Chart – LDX
The stock was analysed as per the current market price of AUD 0.069 per share as on 11 August 2023 at 02:39 PM Sydney, Australia GMT+10.
Note 1: Past performance is neither an Indicator nor a guarantee of future performance.
Technical Indicators Defined:
Support: A level at which the stock prices tend to find support if they are falling, and a downtrend may take a pause backed by demand or buying interest. Support 1 refers to the nearby support level for the stock, and if the price breaches the level, then Support 2 may act as the crucial support level for the stock.
Resistance: A level at which the stock prices tend to find resistance when they are rising, and an uptrend may take a pause due to profit booking or selling interest. Resistance 1 refers to the nearby resistance level for the stock and if the price surpasses the level, then Resistance 2 may act as the crucial resistance level for the stock.
Stop-loss: It is a level to protect further losses in case of unfavourable movement in the stock prices.
The Green colour line reflects the 21-period moving average. SMA helps to identify existing price trends. If the prices are trading above the 21-period, prices are currently in a bullish trend (Vice – Versa).
The Blue colour line reflects the 50-period moving average. SMA helps to identify existing price trends. If the prices are trading above the 50-period, prices are currently in a bullish trend (Vice – Versa).
The Orange/ Yellow colour line represents the Trendline.
The Purple colour line in the chart’s lower segment reflects the Relative Strength Index (14-Period), which indicates price momentum and signals momentum in trend. A reading of 70 or above suggests overbought status, while a reading of 30 or below suggests an oversold status.
Disclaimer
This article has been prepared by Kalkine Media, echoed on the website kalkinemedia.com/au and associated pages, based on the information obtained and collated from the subscription reports prepared by Kalkine Pty. Ltd. [ABN 34 154 808 312; AFSL no. 425376] on Kalkine.com.au (and associated pages). The principal purpose of the content is to provide factual information only for educational purposes. None of the content in this article, including any news, quotes, information, data, text, reports, ratings, opinions, images, photos, graphics, graphs, charts, animations, and video is or is intended to be, advisory in nature. The content does not contain or imply any recommendation or opinion intended to influence your financial decisions, including but not limited to, in respect of any particular security, transaction, or investment strategy, and must not be relied upon by you as such. The content is provided without any express or implied warranties of any kind. Kalkine Media, and its related bodies corporate, agents, and employees (Kalkine Group) cannot and do not warrant the accuracy, completeness, timeliness, merchantability, or fitness for a particular purpose of the content or the website, and to the extent permitted by law, Kalkine Group hereby disclaims any and all such express or implied warranties. Kalkine Group shall NOT be held liable for any investment or trading losses you may incur by using the information shared on our website.
