

Highlights
- Nickel prices bucked the overall commodities market trend and moved higher this week.
- Nickel prices have corrected nearly 20% year-to-date amid rising global production and concerns over weak future demand.
- LME Nickel June Futures' prices are trading above the downward-sloping trendline support zone and taking support from the trendline on the downside.
The commodities market remained lacklustre last week. While precious metals like Gold rose amid concerns over the global economic outlook, most base metals and energy products like crude oil and natural gas prices headed southward amid demand concerns.
This week, the same trend prevailed in the commodities market, with Gold extending its northward movement and other base metals moving lower. However, Nickel prices bucked the trend and moved higher this week. Currently, the June Futures contract (LME: CMNIM23) of this silvery-white lustrous metal is trading around USD 24,800 a tonne on the LME. This metal, extensively used in electric vehicle (EV) batteries, has corrected nearly 20% year-to-date amid rising global production and concerns over weak future demand.
According to the International Nickel Study Group, Nickel production in 2022 exceeded demand by nearly 1,12,000 tonnes, the highest in eight years. Given this backdrop, let's study the price chart of Nickel June Futures contract to get an idea about the near-term outlook of this commodity.
Nickel June Futures Contract (LME: CMNIM23) Technical Indicators:
LME Nickel June Futures' prices are trading above the downward-sloping trendline support zone and taking support from the trendline on the downside, indicating the possibility of an upward movement hereon. The leading indicator RSI (14-period) is showing a reading of ~56.79, recovering from the lower levels. Moreover, the prices are trading above the 21-period and 50-period SMA, which may act as support levels.

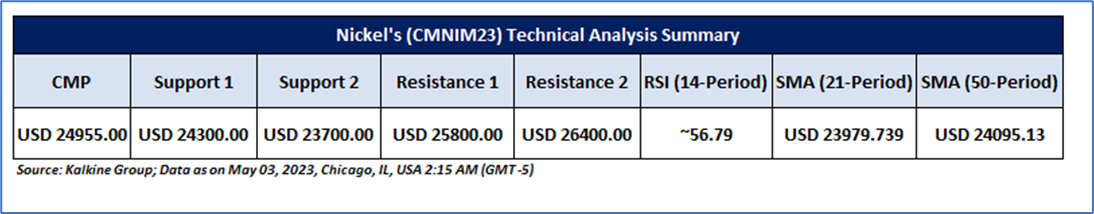
As per the charts, the next crucial resistance levels for Nickel could be USD 25800 and USD 26400, and prices may test these levels in the coming sessions (1-2 weeks).
Note 1: Past performance is neither an Indicator nor a guarantee of future performance.
Technical Indicators Defined:
Support: A level at which the stock prices tend to find support if they are falling, and a downtrend may take a pause backed by demand or buying interest. Support 1 refers to the nearby support level for the stock and if the price breaches the level, then Support 2 may act as the crucial support level for the stock.
Resistance: A level at which the stock prices tend to find resistance when they are rising, and an uptrend may take a pause due to profit booking or selling interest. Resistance 1 refers to the nearby resistance level for the stock and if the price surpasses the level, then Resistance 2 may act as the crucial resistance level for the stock.
Stop-loss: It is a level to protect further losses in case of unfavourable movement in the stock prices.
The Green colour line reflects the 21-period moving average. SMA helps to identify existing price trends. If the prices are trading above the 21-period, prices are currently in a bullish trend (Vice – Versa).
The Blue colour line reflects the 50-period moving average. SMA helps to identify existing price trends. If the prices are trading above the 50-period, prices are currently in a bullish trend (Vice – Versa).
The Orange/ Yellow colour line represents the trendline.
The Purple colour line in the chart’s lower segment reflects the Relative Strength Index (14-Period), which indicates price momentum and signals momentum in trend. A reading of 70 or above suggests overbought status, while a reading of 30 or below suggests an oversold status.
Disclaimer
This article has been prepared by Kalkine Media, echoed on the website kalkinemedia.com/au and associated pages, based on the information obtained and collated from the subscription reports prepared by Kalkine Pty. Ltd. [ABN 34 154 808 312; AFSL no. 425376] on Kalkine.com.au (and associated pages). The principal purpose of the content is to provide factual information only for educational purposes. None of the content in this article, including any news, quotes, information, data, text, reports, ratings, opinions, images, photos, graphics, graphs, charts, animations, and video is or is intended to be, advisory in nature. The content does not contain or imply any recommendation or opinion intended to influence your financial decisions, including but not limited to, in respect of any particular security, transaction, or investment strategy, and must not be relied upon by you as such. The content is provided without any express or implied warranties of any kind. Kalkine Media, and its related bodies corporate, agents, and employees (Kalkine Group) cannot and do not warrant the accuracy, completeness, timeliness, merchantability, or fitness for a particular purpose of the content or the website, and to the extent permitted by law, Kalkine Group hereby disclaims any and all such express or implied warranties. Kalkine Group shall NOT be held liable for any investment or trading losses you may incur by using the information shared on our website.
