

Highlights
- Kina Securities Limited (ASX:KSL) shares are down 11.11% in one year.
- On Friday's closing price, KSL's dividend yield was 11.85%.
- The company announced a final dividend of AU 6.5 cents per share in February this year, taking its full-year 2022 dividends to AU 10.6 cents.
Shares of Kina Securities Limited (ASX:KSL), a diversified financial services provider based in Guinea, witnessed some rebound last week after hitting a 52-week low of AUD 0.710 on 3 May 2023. On Friday, the stock closed at AUD 0.760, taking its one-week gains to 4.11%. It may be noted that KSL shares have been on a downtrend over the last one year and have corrected 11.11% in the same time frame.
Although Kina Securities Ltd is not among those ASX-listed financial stocks discussed often, it has an impressive dividend yield. On Friday's closing price, KSL's dividend yield was 11.85%. The company, which offers services like commercial banking, fund administration, investment management services, and stock brokerage, announced a final dividend of AU 6.5 cents per share in February this year, taking its full-year 2022 dividends to AU 10.6 cents, 6% higher than the dividend paid on FY21.
For the full year ended 31 December 2022, the company reported a net profit of PKG 106.1 million on revenues of PKG 410 million. While its revenues grew 9.6% year-on-year, its net profit rose 10.3% over pcp. Its underlying return on equity was 17.9% for FY22 compared to 16.7% in FY21. Despite this financial performance, the stock's up move witnessed in early March 2023 could not sustain.
One of the reasons behind KSL shares' gains in March could be its inclusion in the ASX All Ordinaries index, effective March 20, 2023. However, of late, the stock was languishing and is down over 12% in the last six months. Let's study the price chart of KSL to understand its near-term price trend.
KSL’s Technical Analysis:
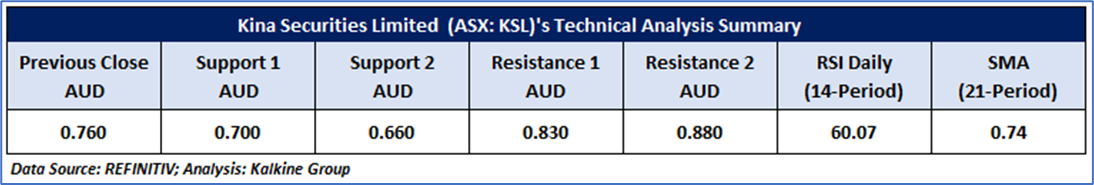
On the daily chart, KSL's price is forming a falling wedge pattern and developing two consecutive bottom divergences compared to the RSI (14-period), suggesting a positive bias. In addition, the RSI (14-period) is trending north and is trading near the level of 60, supporting an upside movement. Prices are trading above both the 21-period and 50-period SMAs, which may serve as support levels for the stock. Important support level for the stock is positioned at AUD 0.660, while significant resistance is located at AUD 0.830.
Daily Technical Chart – KSL
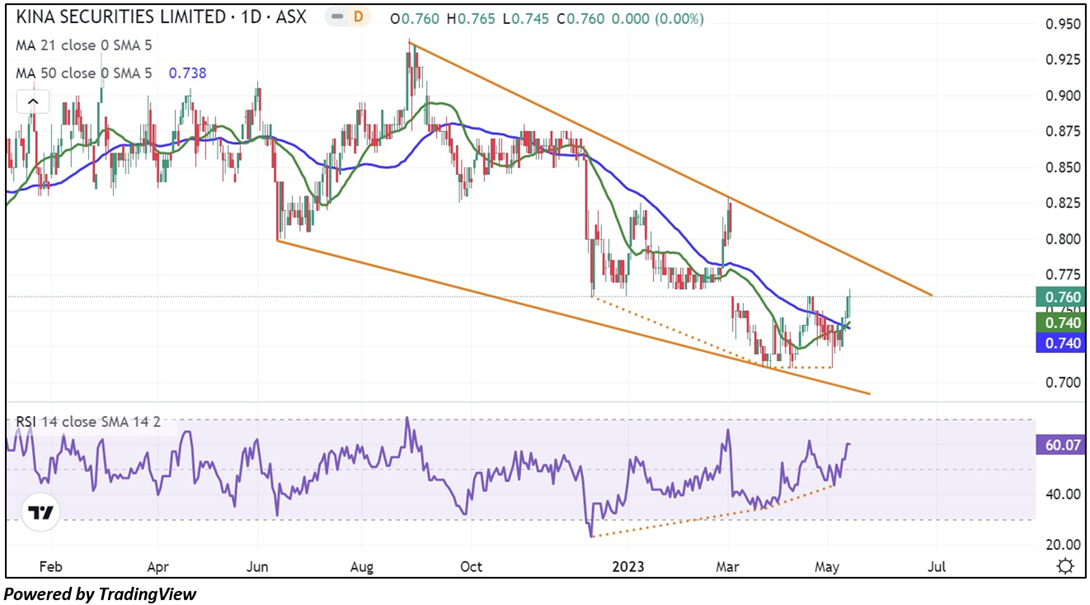
The technical levels for the stock were evaluated as per the closing price of AUD 0.760 per share as on 12 May 2023.
Note 1: Past performance is neither an Indicator nor a guarantee of future performance.
Technical Indicators Defined:
Support: A level at which the stock prices tend to find support if they are falling, and a downtrend may take a pause backed by demand or buying interest. Support 1 refers to the nearby support level for the stock, and if the price breaches the level, then Support 2 may act as the crucial support level for the stock.
Resistance: A level at which the stock prices tend to find resistance when they are rising, and an uptrend may take a pause due to profit booking or selling interest. Resistance 1 refers to the nearby resistance level for the stock and if the price surpasses the level, then Resistance 2 may act as the crucial resistance level for the stock.
Stop-loss: It is a level to protect further losses in case of unfavourable movement in the stock prices.
The Green colour line reflects the 21-period moving average. SMA helps to identify existing price trends. If the prices are trading above the 21-period, prices are currently in a bullish trend (Vice – Versa).
The Blue colour line reflects the 50-period moving average. SMA helps to identify existing price trends. If the prices are trading above the 50-period, prices are currently in a bullish trend (Vice – Versa).
The Orange/ Yellow colour line represents the Trendline.
The Purple colour line in the chart’s lower segment reflects the Relative Strength Index (14-Period), which indicates price momentum and signals momentum in trend. A reading of 70 or above suggests overbought status, while a reading of 30 or below suggests an oversold status.
Disclaimer
This article has been prepared by Kalkine Media, echoed on the website kalkinemedia.com/au and associated pages, based on the information obtained and collated from the subscription reports prepared by Kalkine Pty. Ltd. [ABN 34 154 808 312; AFSL no. 425376] on Kalkine.com.au (and associated pages). The principal purpose of the content is to provide factual information only for educational purposes. None of the content in this article, including any news, quotes, information, data, text, reports, ratings, opinions, images, photos, graphics, graphs, charts, animations, and video is or is intended to be, advisory in nature. The content does not contain or imply any recommendation or opinion intended to influence your financial decisions, including but not limited to, in respect of any particular security, transaction, or investment strategy, and must not be relied upon by you as such. The content is provided without any express or implied warranties of any kind. Kalkine Media, and its related bodies corporate, agents, and employees (Kalkine Group) cannot and do not warrant the accuracy, completeness, timeliness, merchantability, or fitness for a particular purpose of the content or the website, and to the extent permitted by law, Kalkine Group hereby disclaims any and all such express or implied warranties. Kalkine Group shall NOT be held liable for any investment or trading losses you may incur by using the information shared on our website.
