

_06_16_2026_04_54_27_535266.jpg)


Highlights
- DDH shares witnessed huge buying interest and ended with more than 6% gains on Monday
- The company today announced that Perenti Ltd (ASX:PRN) will acquire the company through a scheme of arrangement.
- If this merger goes through, then Perenti shareholders will hold 71%, while DDH shareholders will own 29% of the proposed merged entity
Mining services provider DDH1 Limited (ASX:DDH) witnessed huge buying interest and ended with more than 6% gains on Monday (26 June 2023) after the company announced that Perenti Ltd (ASX:PRN) would acquire the company through a scheme of arrangement. DDH shares closed at AUD 0.915, up 6.395%, on Monday, taking its gains in the last one month to 11.60%.
According to the announcement by DDH, each shareholder of the company will receive 0.711 Perenti shares and AUD 0.1238 in cash for every DDH share they hold by them. This transaction values DDH shares at AUD 1.01, a premium of 17.4% on DDH's 5-day VWAPs through 23 June 2023.
If this merger goes through, then Perenti shareholders will hold 71%, while DDH shareholders will own 29% of the proposed merged entity.
As per the company, this deal will bring in synergies for both companies and lead to double-digit EPS accretion. DDH estimates post-tax synergies to be nearly AUD 22 million in FY24.
Following Monday's rally, DDH shares are sitting on a gain of around 35% in the last one year. Let's study the price chart of DDH to get clues about its possible near term direction.
DDH’s Technical Analysis:
On the daily chart, DDH share price is sustaining above the downward-sloping trendline support level and continuously taking support from the trendline, indicating the possibility of further upside hereon. Now the stock could head toward its next resistance level at AUD 1.04, and in the short term (2-4 weeks), prices may test this level. If the stock manages to move above AUD 1.04 level supported by volumes, then levels of AUD 1.10 could be seen.
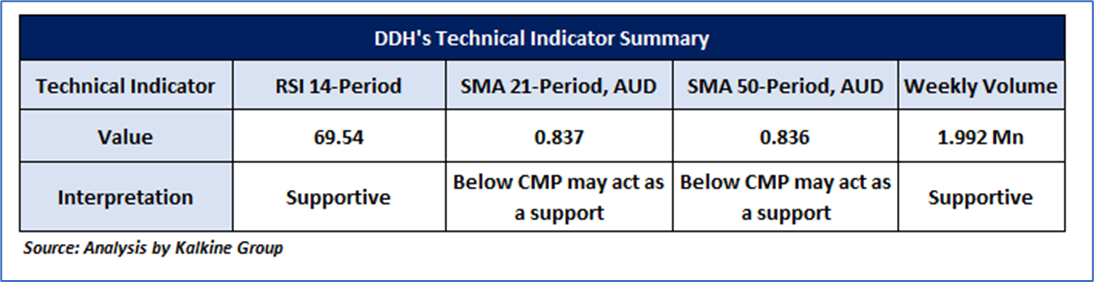
On the weekly chart, RSI (14-period) is moving in a positive zone and showing a reading of ~69.54 level, indicating positive price momentum. The stock is trading above its 21-period and 50-period SMA, which could act as immediate support for the stock. Moreover, the weekly volumes also seem supportive of the upside movement.
Daily Technical Chart – DDH
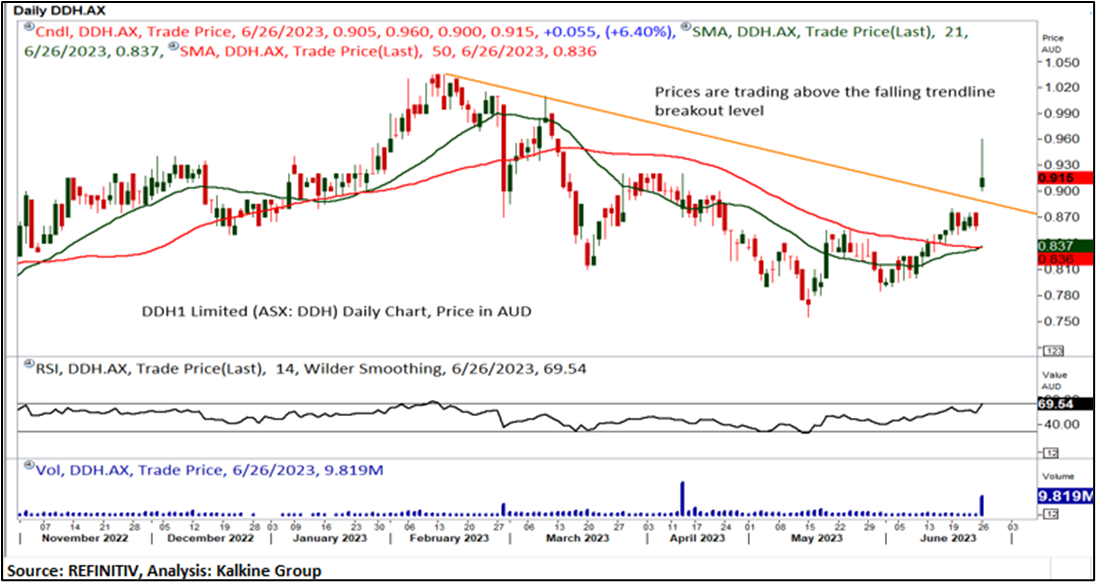
The technical levels for the stock were evaluated as per the closing price of AUD 0.915 per share, up 6.395%, as on 26 June 2023.
Note 1: Past performance is neither an Indicator nor a guarantee of future performance.
Technical Indicators Defined:
Support: A level at which the stock prices tend to find support if they are falling, and a downtrend may take a pause backed by demand or buying interest. Support 1 refers to the nearby support level for the stock, and if the price breaches the level, then Support 2 may act as the crucial support level for the stock.
Resistance: A level at which the stock prices tend to find resistance when they are rising, and an uptrend may take a pause due to profit booking or selling interest. Resistance 1 refers to the nearby resistance level for the stock and if the price surpasses the level, then Resistance 2 may act as the crucial resistance level for the stock.
Stop-loss: It is a level to protect further losses in case of unfavourable movement in the stock prices.
The Green colour line reflects the 21-period moving average. SMA helps to identify existing price trends. If the prices are trading above the 21-period, prices are currently in a bullish trend (Vice – Versa).
The Blue colour line reflects the 50-period moving average. SMA helps to identify existing price trends. If the prices are trading above the 50-period, prices are currently in a bullish trend (Vice – Versa).
The Orange/ Yellow colour line represents the Trendline.
The Purple colour line in the chart’s lower segment reflects the Relative Strength Index (14-Period), which indicates price momentum and signals momentum in trend. A reading of 70 or above suggests overbought status, while a reading of 30 or below suggests an oversold status.
Disclaimer
This article has been prepared by Kalkine Media, echoed on the website kalkinemedia.com/au and associated pages, based on the information obtained and collated from the subscription reports prepared by Kalkine Pty. Ltd. [ABN 34 154 808 312; AFSL no. 425376] on Kalkine.com.au (and associated pages). The principal purpose of the content is to provide factual information only for educational purposes. None of the content in this article, including any news, quotes, information, data, text, reports, ratings, opinions, images, photos, graphics, graphs, charts, animations, and video is or is intended to be, advisory in nature. The content does not contain or imply any recommendation or opinion intended to influence your financial decisions, including but not limited to, in respect of any particular security, transaction, or investment strategy, and must not be relied upon by you as such. The content is provided without any express or implied warranties of any kind. Kalkine Media, and its related bodies corporate, agents, and employees (Kalkine Group) cannot and do not warrant the accuracy, completeness, timeliness, merchantability, or fitness for a particular purpose of the content or the website, and to the extent permitted by law, Kalkine Group hereby disclaims any and all such express or implied warranties. Kalkine Group shall NOT be held liable for any investment or trading losses you may incur by using the information shared on our website.
