


Highlights
- QuickFee Limited (ASX:QFE) offers digital payment and financing options
- The performance of QFE shares has not been satisfactory, as they have been falling since February 2021
- Let's study its technical chart to get an insight into its near term movement
ASX-listed QuickFee Limited (ASX:QFE) offers digital payment and financing options to various professionals, businesses, and individuals in Australia and the United States. In FY22, 82% of its revenues came from the United States, while 18% came from Australia.
However, the performance of QFE shares has not been satisfactory as they have been falling since February 2021. On Tuesday, 13 June 2023, QFE shares ended 1.69% higher at AUD 0.060. In the previous one year, the stock declined nearly 20%. After witnessing a 52-week low of AUD 0.049 on 22 March 2023, QFE shares witnessed some rebound but have struggled to scale further upside. Let’s study its technical chart to get an insight into its near-term movement.
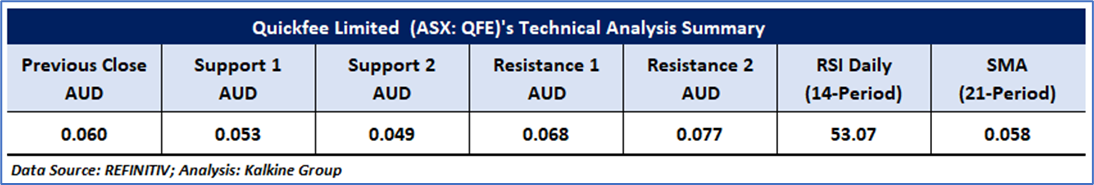
QFE’s Technical Analysis:
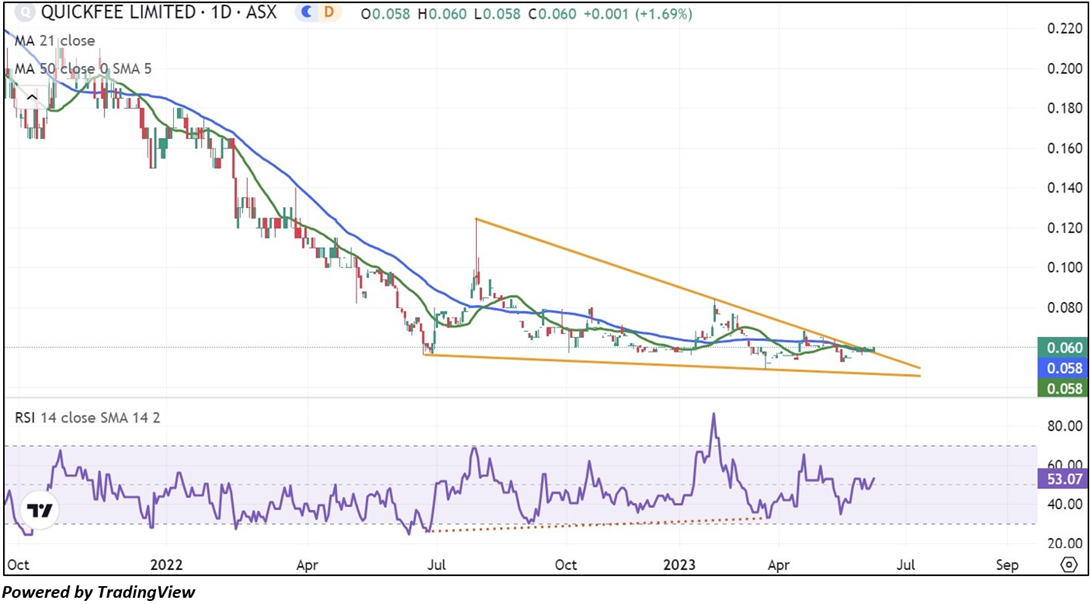
As shown in the daily chart below, QFE shares are testing the upper boundary of a falling wedge pattern, which is a positive indicator and suggests that if the pattern is successfully broken, then the stock may gain upward momentum. Furthermore, the stock price has crossed both the 21-period and 50-period SMAs, supporting the positive bias. But it is still 5.83% away from its 200-day SMA.
The RSI (14-period) is also moving in a positive zone with a reading of 53.07. An important support level for the stock is at AUD 0.053, while a key resistance level is at AUD 0.068.
Daily Technical Chart – QFE
The technical levels for the stock were evaluated as per the closing price of AUD 0.060 per share, up 1.69%, as on 13 June 2023.
Note 1: Past performance is neither an Indicator nor a guarantee of future performance.
Technical Indicators Defined:
Support: A level at which the stock prices tend to find support if they are falling, and a downtrend may take a pause backed by demand or buying interest. Support 1 refers to the nearby support level for the stock, and if the price breaches the level, then Support 2 may act as the crucial support level for the stock.
Resistance: A level at which the stock prices tend to find resistance when they are rising, and an uptrend may take a pause due to profit booking or selling interest. Resistance 1 refers to the nearby resistance level for the stock and if the price surpasses the level, then Resistance 2 may act as the crucial resistance level for the stock.
Stop-loss: It is a level to protect further losses in case of unfavourable movement in the stock prices.
The Green colour line reflects the 21-period moving average. SMA helps to identify existing price trends. If the prices are trading above the 21-period, prices are currently in a bullish trend (Vice – Versa).
The Blue colour line reflects the 50-period moving average. SMA helps to identify existing price trends. If the prices are trading above the 50-period, prices are currently in a bullish trend (Vice – Versa).
The Orange/ Yellow colour line represents the Trendline.
The Purple colour line in the chart’s lower segment reflects the Relative Strength Index (14-Period), which indicates price momentum and signals momentum in trend. A reading of 70 or above suggests overbought status, while a reading of 30 or below suggests an oversold status.
Disclaimer
This article has been prepared by Kalkine Media, echoed on the website kalkinemedia.com/au and associated pages, based on the information obtained and collated from the subscription reports prepared by Kalkine Pty. Ltd. [ABN 34 154 808 312; AFSL no. 425376] on Kalkine.com.au (and associated pages). The principal purpose of the content is to provide factual information only for educational purposes. None of the content in this article, including any news, quotes, information, data, text, reports, ratings, opinions, images, photos, graphics, graphs, charts, animations, and video is or is intended to be, advisory in nature. The content does not contain or imply any recommendation or opinion intended to influence your financial decisions, including but not limited to, in respect of any particular security, transaction, or investment strategy, and must not be relied upon by you as such. The content is provided without any express or implied warranties of any kind. Kalkine Media, and its related bodies corporate, agents, and employees (Kalkine Group) cannot and do not warrant the accuracy, completeness, timeliness, merchantability, or fitness for a particular purpose of the content or the website, and to the extent permitted by law, Kalkine Group hereby disclaims any and all such express or implied warranties. Kalkine Group shall NOT be held liable for any investment or trading losses you may incur by using the information shared on our website.
